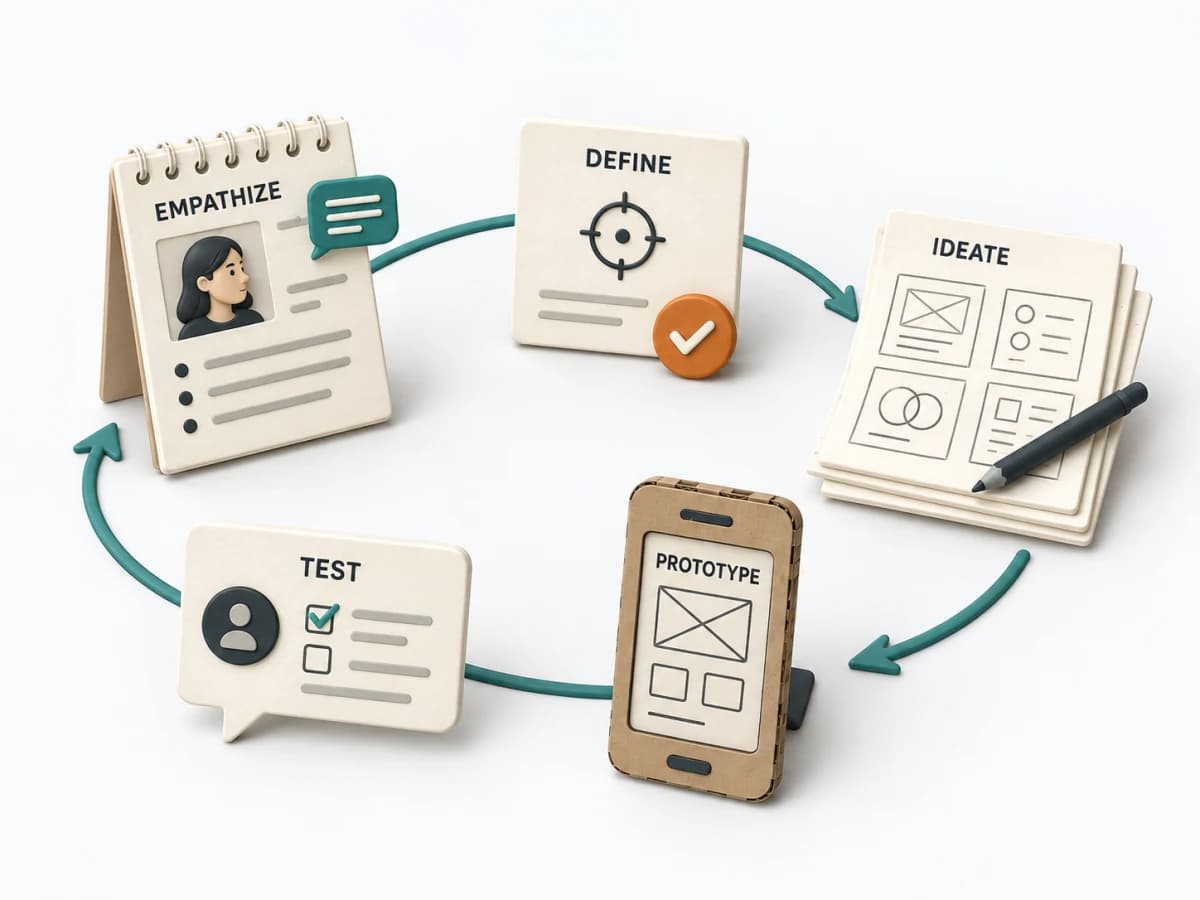
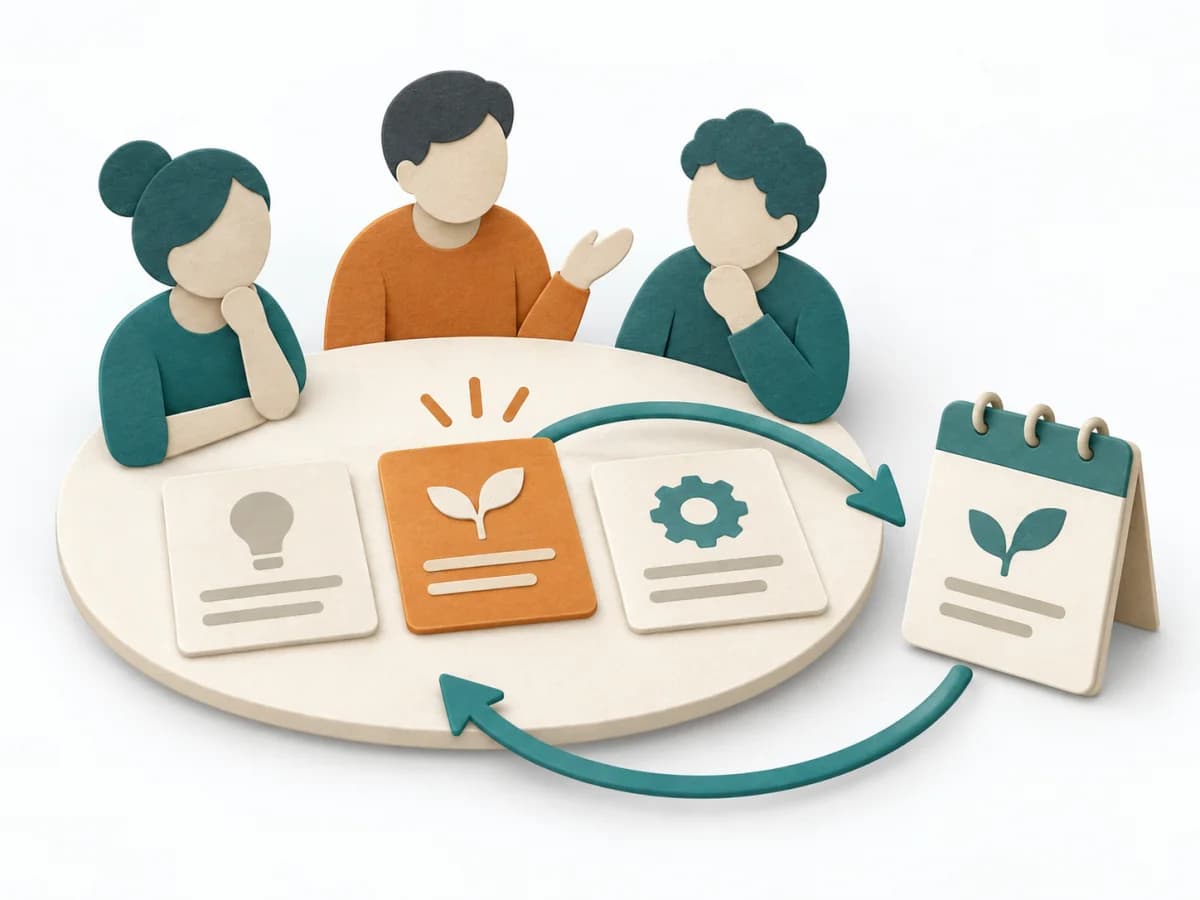
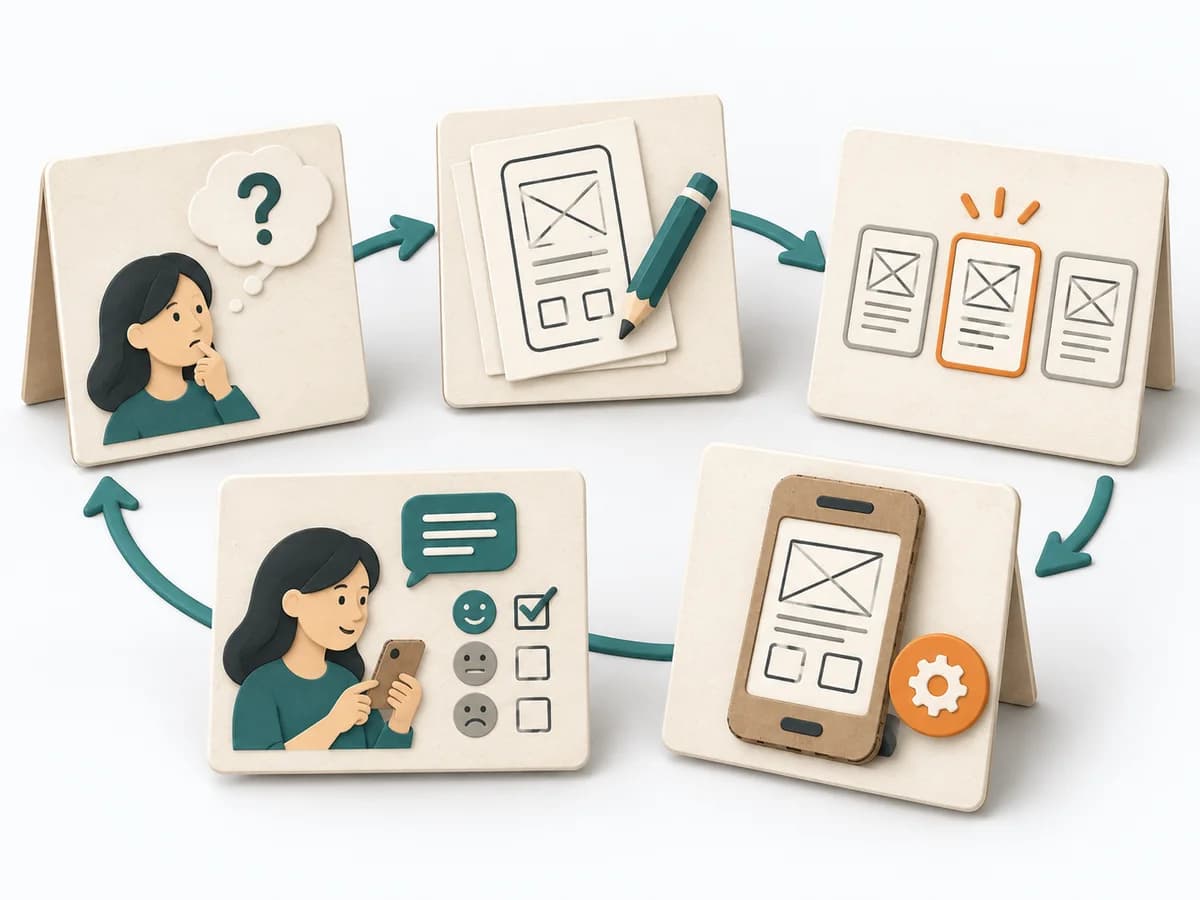
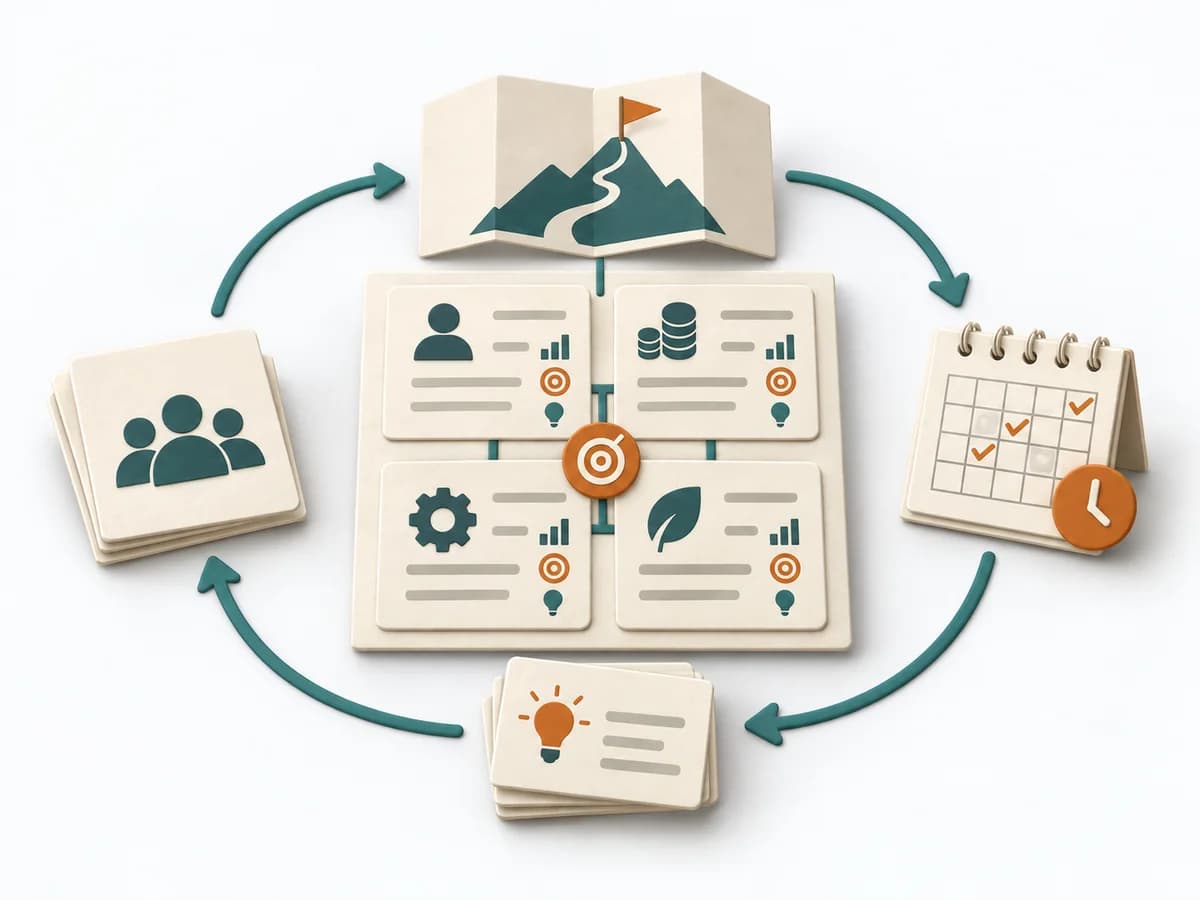
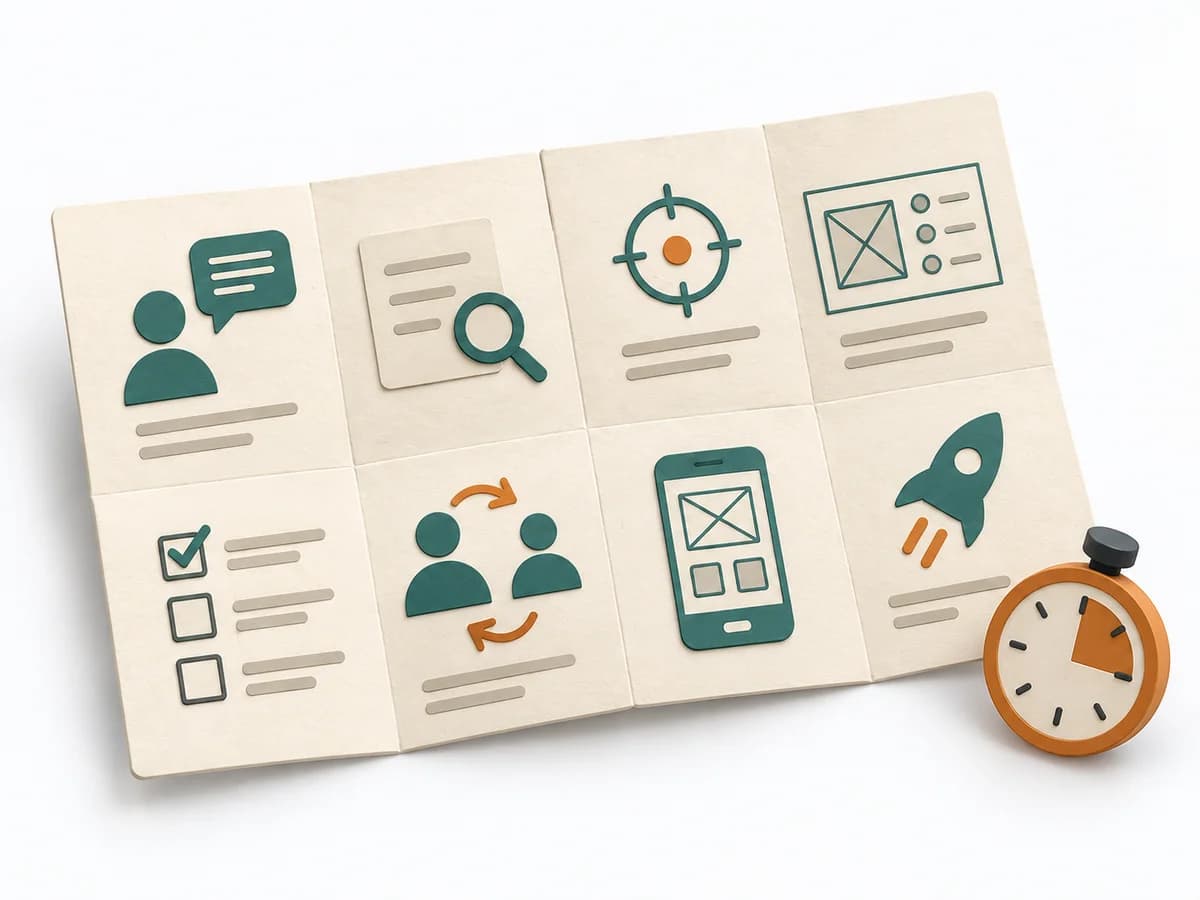
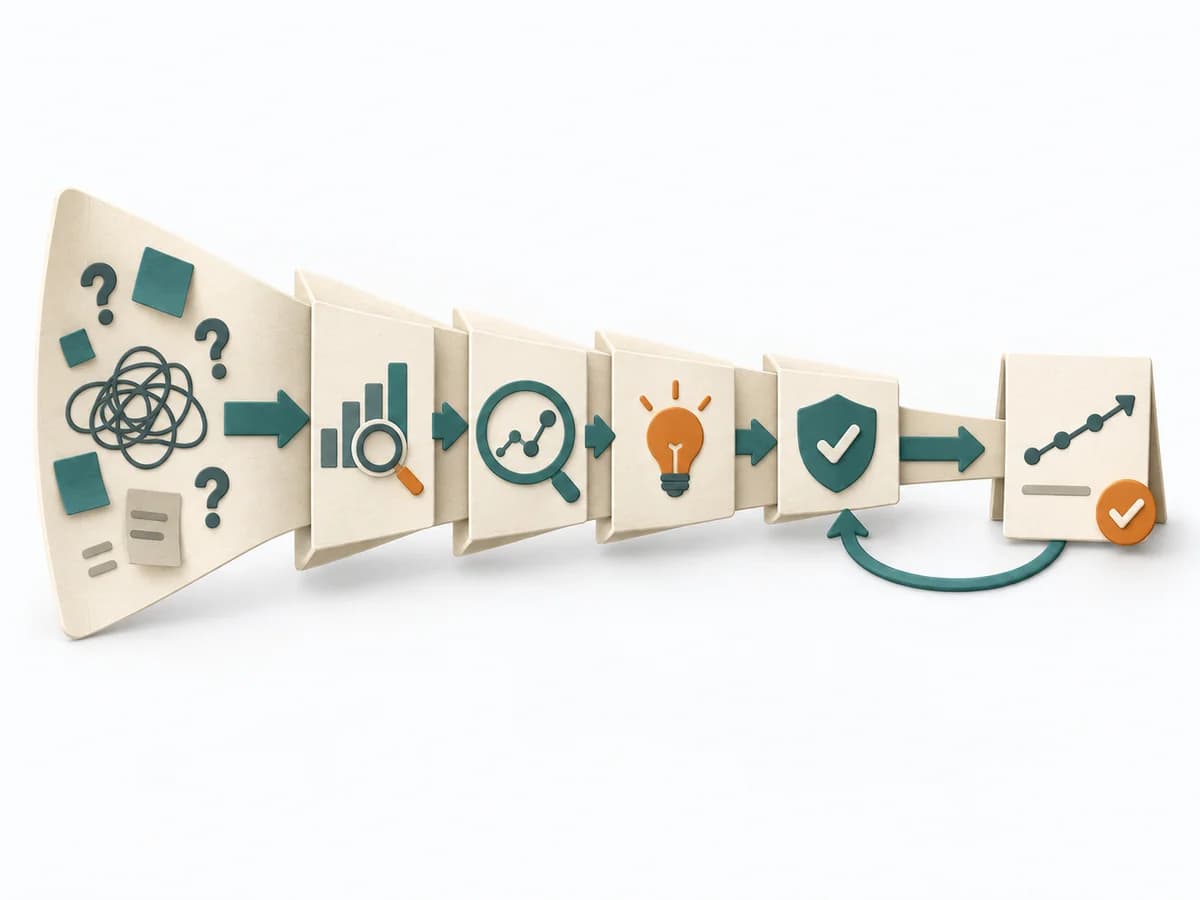
Brings research, problem statement, prototype, and test learnings into a continuous learning loop.
Core question: Which real user problem is worth solving, and which solution idea survives a test with real users?
FrameworkMethod form: Framework. Describes how this method is used in practice.HighComplexity: high. Estimates preparation, facilitation effort, and method confidence needed.WorkshopFormat: workshop. Shows whether the method works in a workshop, asynchronously, or both.
1 Tag bis mehrere Wochen
4-10
Details
Domain ModelingCategory: Domain Modeling. Describes the method's domain of use.
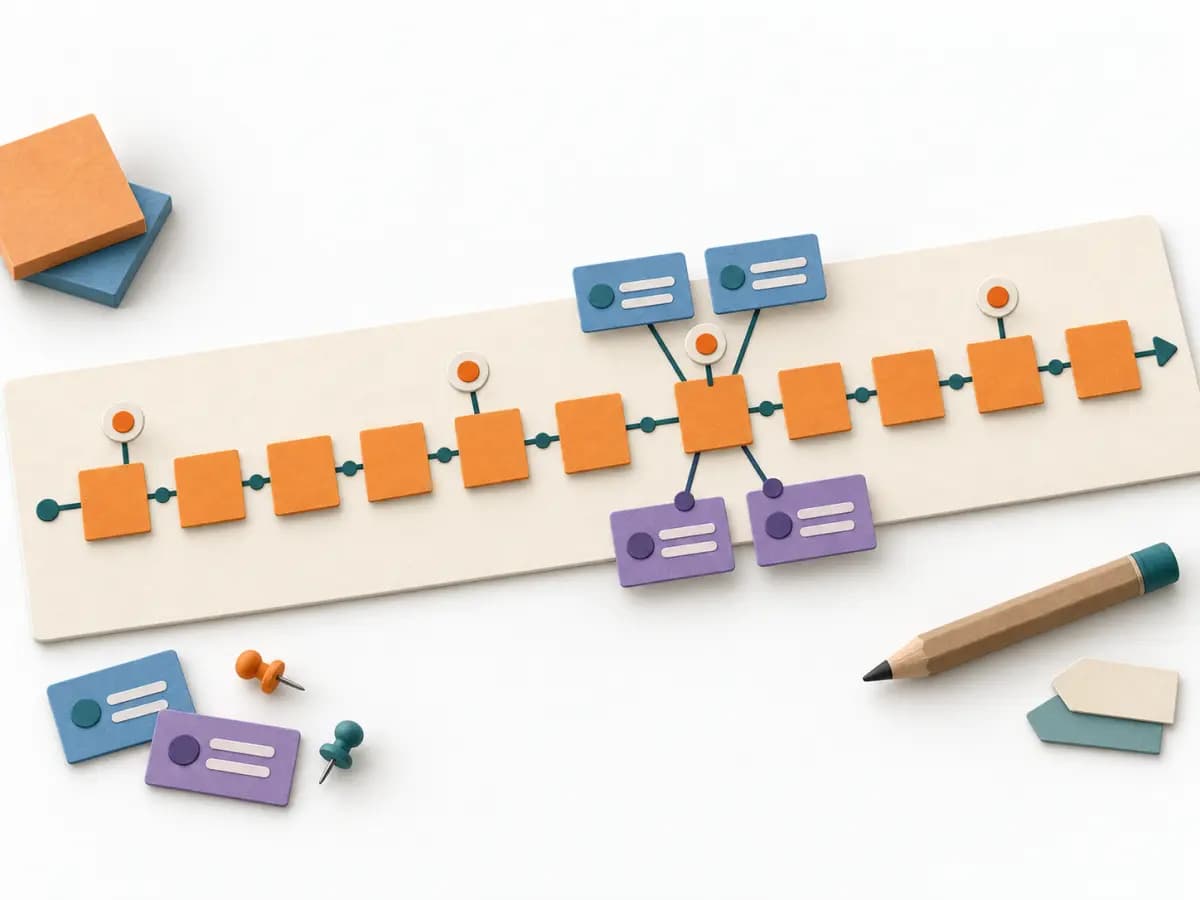
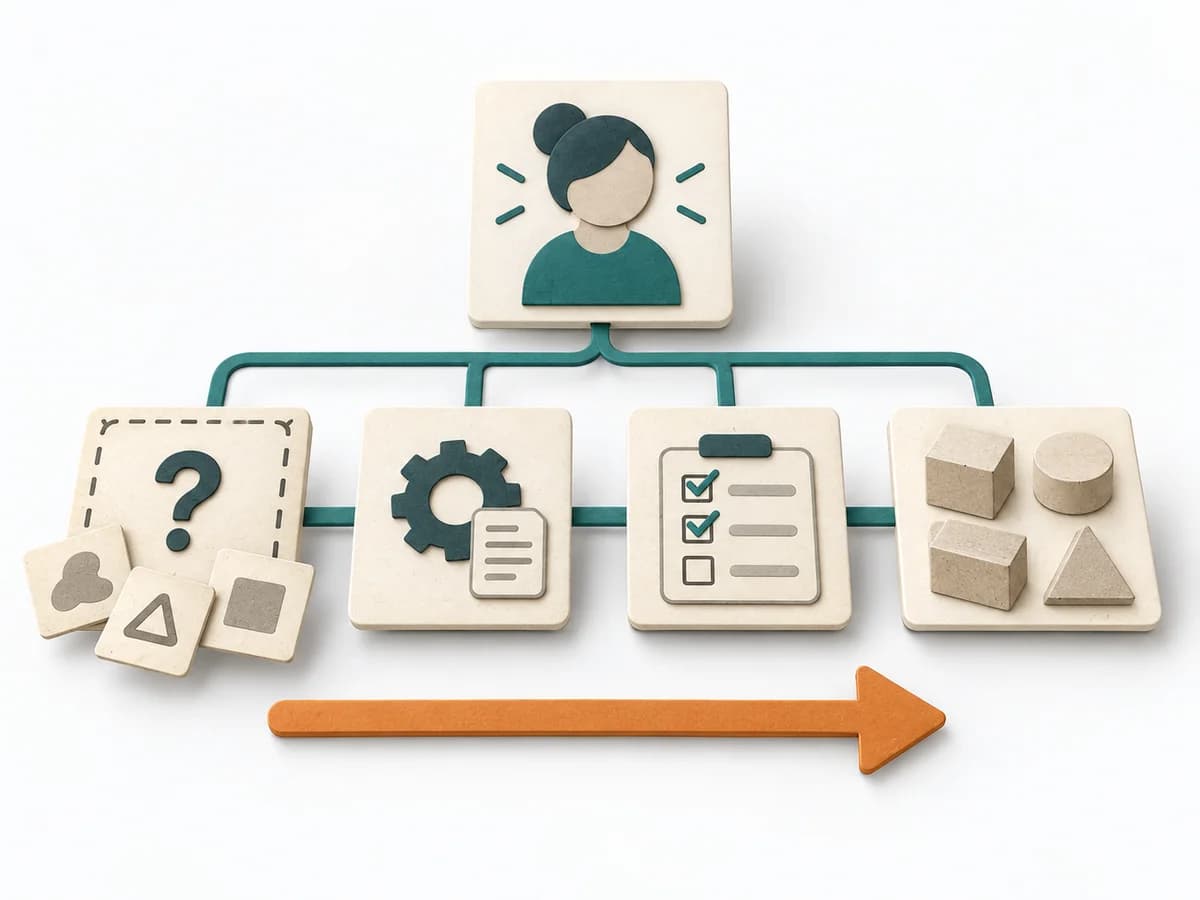
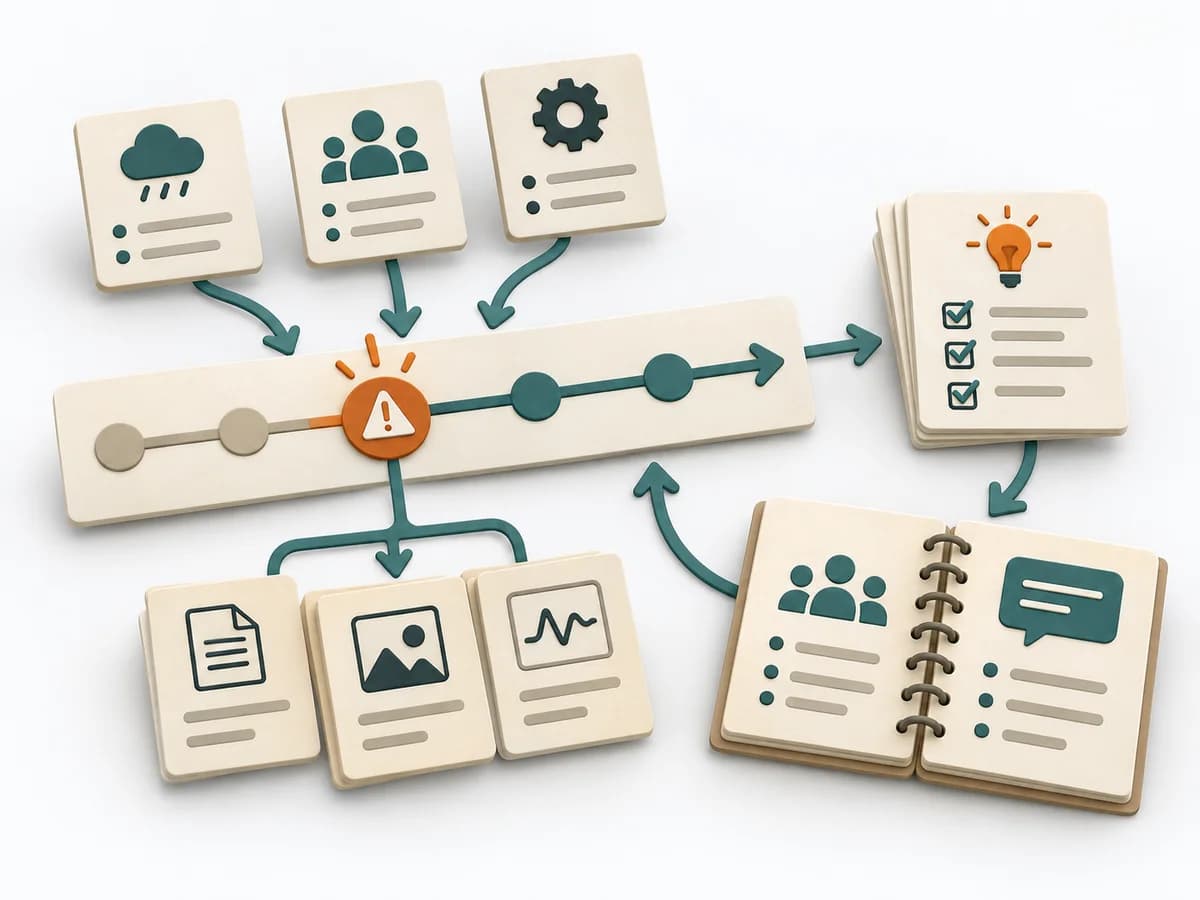
Makes domain knowledge visible as a chronological wall of events, from domain events through commands to bounded contexts.
Core question: Which business events, triggers, and boundaries shape the flow, and where do friction, risk, or learning needs arise?
Workshop methodMethod form: Workshop method. Describes how this method is used in practice.MediumComplexity: medium. Estimates preparation, facilitation effort, and method confidence needed.WorkshopFormat: workshop. Shows whether the method works in a workshop, asynchronously, or both.
2-8 h
5-12
Details
AgileCategory: Agile. Describes the method's domain of use.
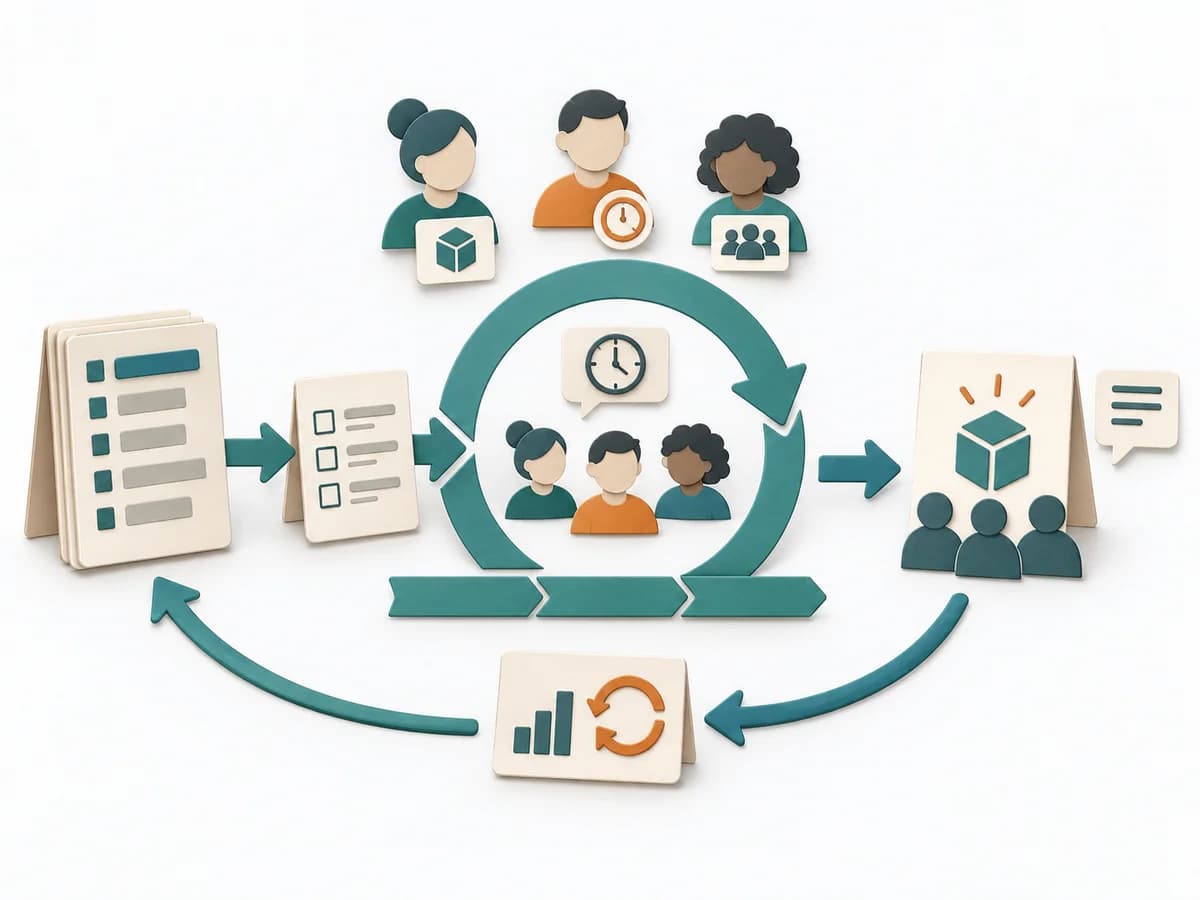
Product Backlog, Sprint Goal, Increment, and retrospective loops create a repeatable cadence for complex product work.
Core question: How does the Scrum Team create a usable Increment every Sprint and learn from outcome and ways of working?
FrameworkMethod form: Framework. Describes how this method is used in practice.MediumComplexity: medium. Estimates preparation, facilitation effort, and method confidence needed.Workshop + asyncFormat: workshop or async. Shows whether the method works in a workshop, asynchronously, or both.
1-4 Wochen je Sprint, laufend
3-10 (Scrum Team)
Details
UX ResearchCategory: UX Research. Describes the method's domain of use.
Bundles phases, emotions, and pain points along a journey to prioritize opportunities and critical moments.
Core question: How does this group experience the chosen scenario across its phases, and where would learning or improvement help?
Mapping toolMethod form: Mapping tool. Describes how this method is used in practice.MediumComplexity: medium. Estimates preparation, facilitation effort, and method confidence needed.WorkshopFormat: workshop. Shows whether the method works in a workshop, asynchronously, or both.
2-4 h
4-10
Details
Product StrategyCategory: Product Strategy. Describes the method's domain of use.
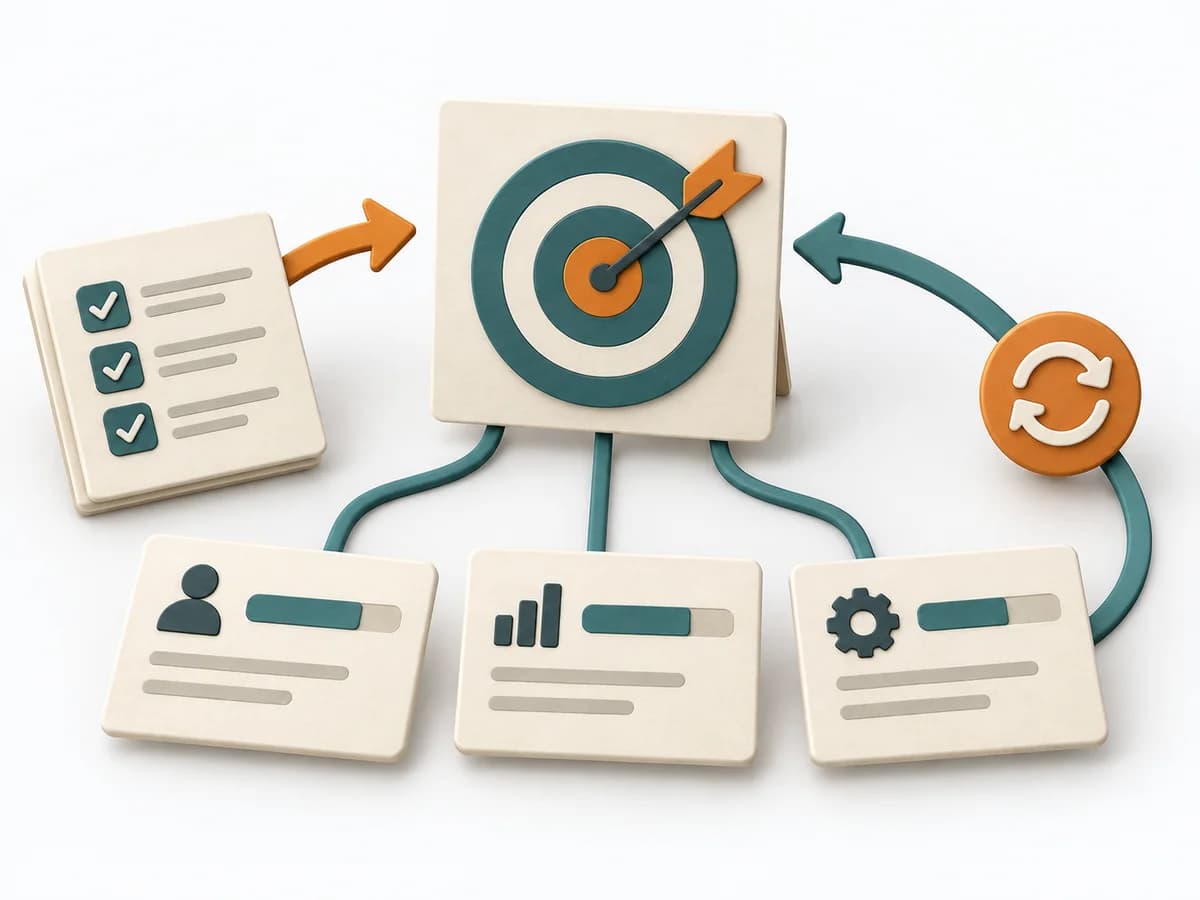
Translates priorities into objectives, key results, and a review cadence so progress stays measurably steerable.
Core question: What measurable outcome will this team achieve in the cycle?
Planning toolMethod form: Planning tool. Describes how this method is used in practice.MediumComplexity: medium. Estimates preparation, facilitation effort, and method confidence needed.Workshop + asyncFormat: workshop or async. Shows whether the method works in a workshop, asynchronously, or both.
1-2 h Setup
2-20
Details
DeliveryCategory: Delivery. Describes the method's domain of use.
Prioritizes requirements across must, should, could, and won't, creating a negotiable release set with clear boundaries.
Core question: Which requirements must be in this release, which are negotiable, and what is deliberately left for later?
Decision methodMethod form: Decision method. Describes how this method is used in practice.LowComplexity: low. Estimates preparation, facilitation effort, and method confidence needed.Workshop + asyncFormat: workshop or async. Shows whether the method works in a workshop, asynchronously, or both.
30-90 min
3-12
Details
AgileCategory: Agile. Describes the method's domain of use.
Makes patterns from a sprint visible and derives concrete improvements for the next work cycle.
Core question: What affected the quality and effectiveness of the last Sprint, and which change will we inspect next Sprint?
Facilitation methodMethod form: Facilitation method. Describes how this method is used in practice.LowComplexity: low. Estimates preparation, facilitation effort, and method confidence needed.WorkshopFormat: workshop. Shows whether the method works in a workshop, asynchronously, or both.
Up to 3 hours for a one-month Sprint; shorter Sprints are usually shorter
Scrum Team
Details
Business StrategyCategory: Business Strategy. Describes the method's domain of use.
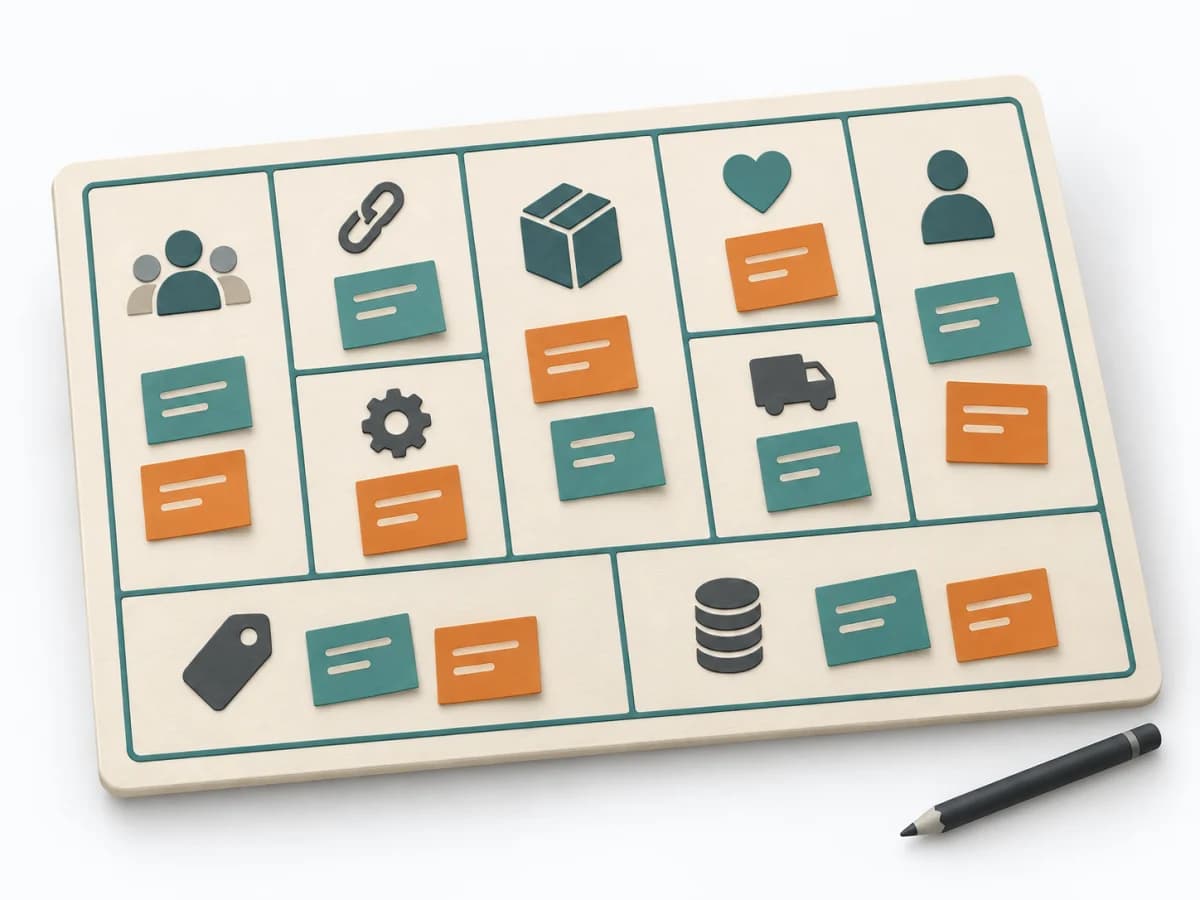
Arranges business building blocks, assumptions, and hypotheses so model variants become more clearly comparable.
Core question: How does this business model create, deliver and capture value, and which assumption could challenge it first?
CanvasMethod form: Canvas. Describes how this method is used in practice.MediumComplexity: medium. Estimates preparation, facilitation effort, and method confidence needed.Workshop + asyncFormat: workshop or async. Shows whether the method works in a workshop, asynchronously, or both.
1-2 h
2-8
Details
UX ResearchCategory: UX Research. Describes the method's domain of use.
Condenses conversations into themes, insights, and questions so needs and patterns become visible with evidence.
Core question: Which experiences, needs and motivations shape this situation, and what do we still need to learn?
Research methodMethod form: Research method. Describes how this method is used in practice.LowComplexity: low. Estimates preparation, facilitation effort, and method confidence needed.Workshop + asyncFormat: workshop or async. Shows whether the method works in a workshop, asynchronously, or both.
30–60 min per interview
1 participant per interview
Details
Product DiscoveryCategory: Product Discovery. Describes the method's domain of use.
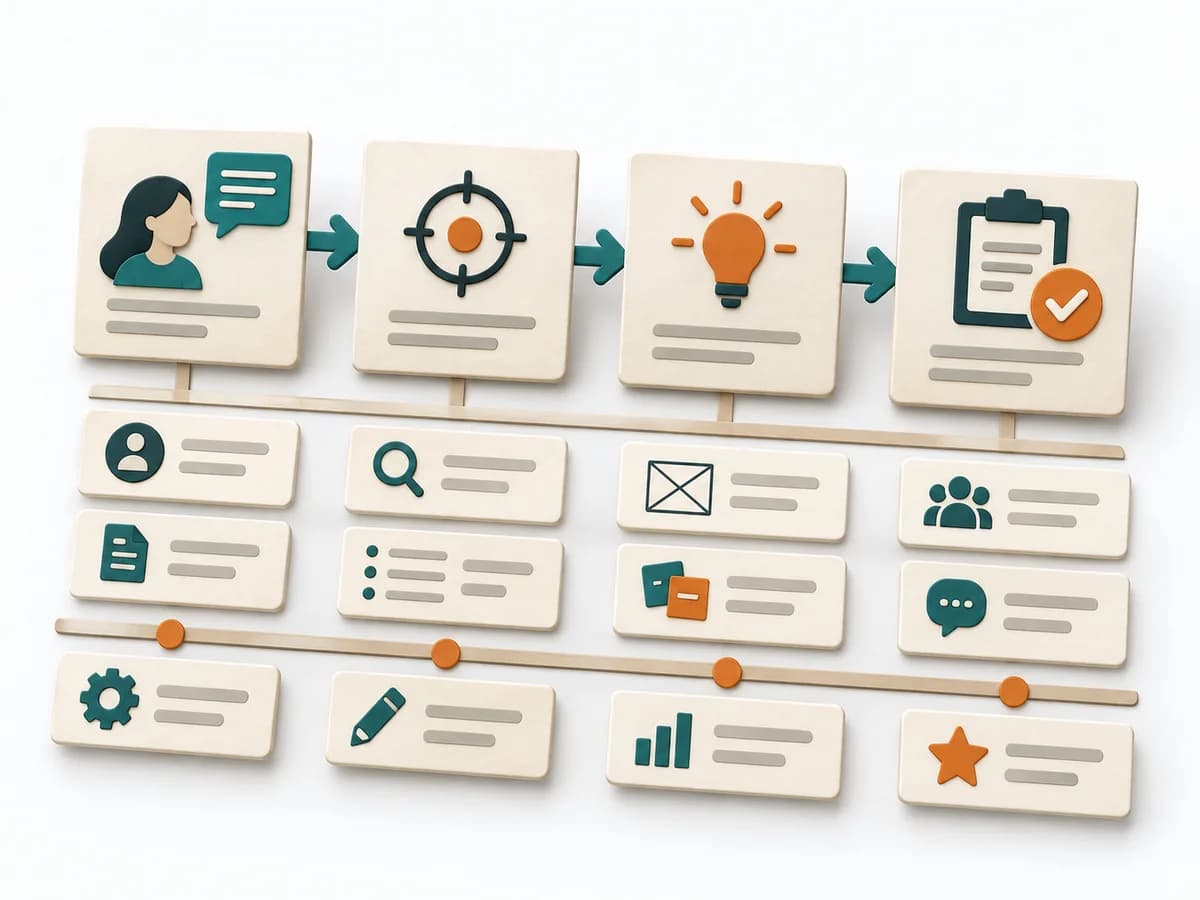
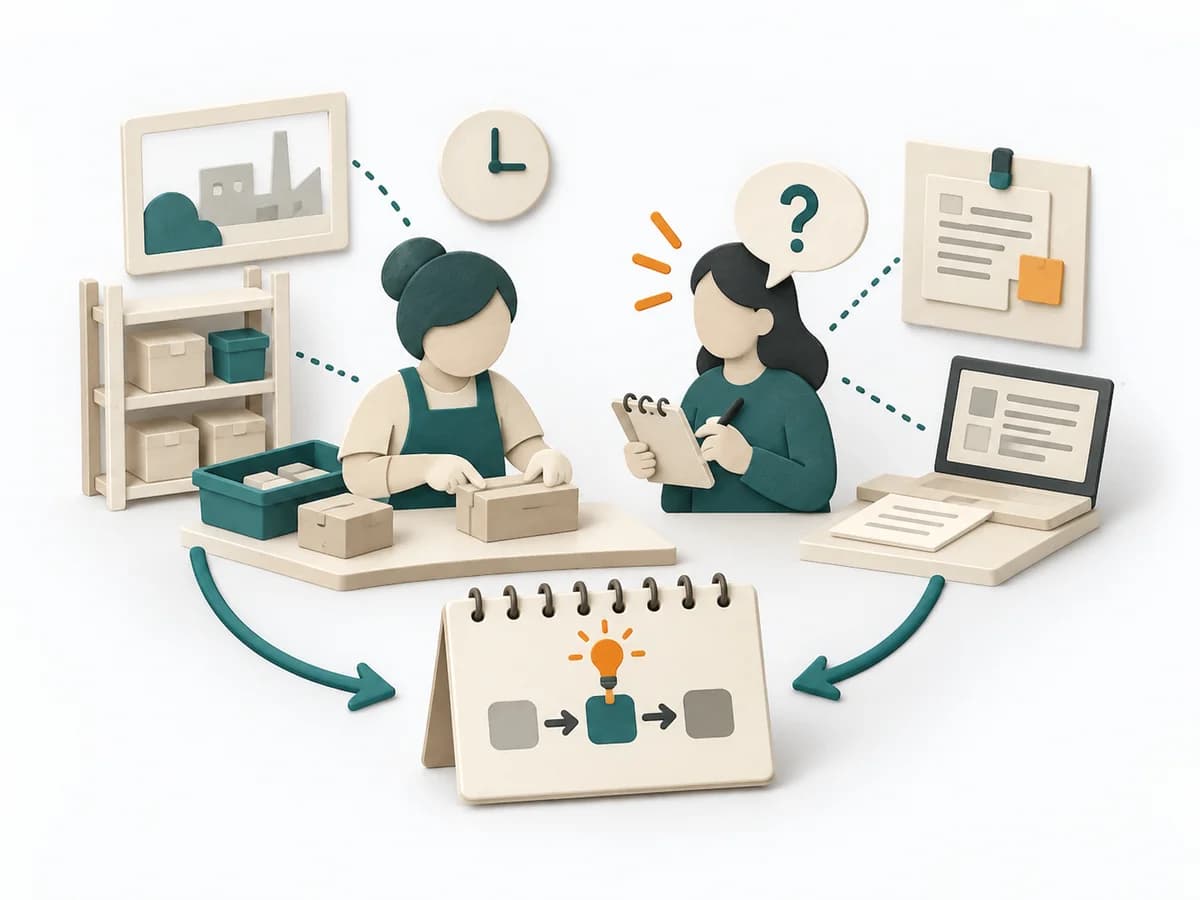
Arranges user goals and activities into a story map that reveals the MVP cut and release slices.
Core question: How do users move from their starting point to their goal, and which smallest coherent deliveries support them?
Mapping toolMethod form: Mapping tool. Describes how this method is used in practice.MediumComplexity: medium. Estimates preparation, facilitation effort, and method confidence needed.WorkshopFormat: workshop. Shows whether the method works in a workshop, asynchronously, or both.
2-4 h
4-10
Details
InnovationCategory: Innovation. Describes the method's domain of use.
Brings problem space, prototype, and test findings together in a few days, enabling a well-founded decision.
Core question: Can a prototype test the riskiest assumption with target users?
Process modelMethod form: Process model. Describes how this method is used in practice.HighComplexity: high. Estimates preparation, facilitation effort, and method confidence needed.WorkshopFormat: workshop. Shows whether the method works in a workshop, asynchronously, or both.
4-5 Tage
5-8
Details
EngineeringCategory: Engineering. Describes the method's domain of use.
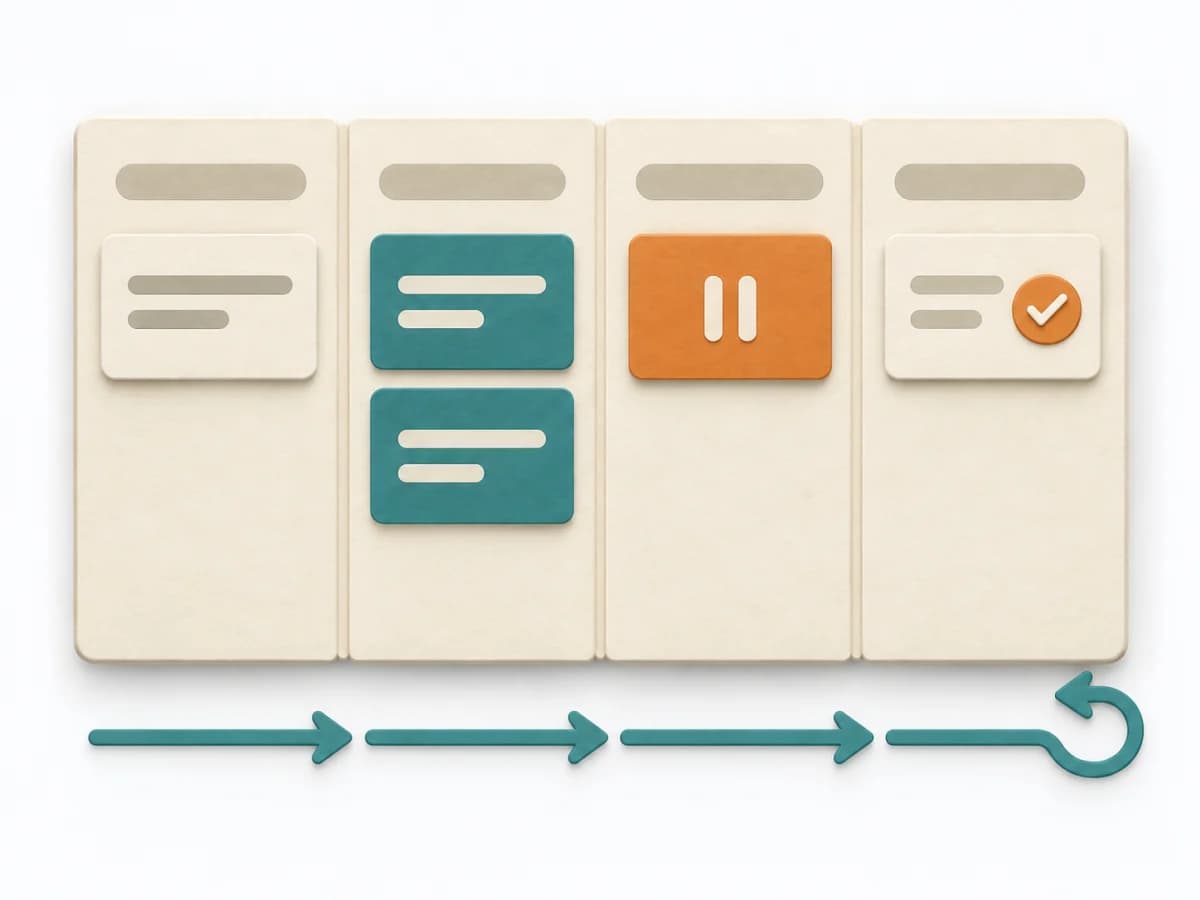
Makes work visible, limits WIP, and uses flow metrics to show where a technical system is slowing down.
Core question: What helps us finish started work promptly and more predictably within our agreed workflow?
Operating practiceMethod form: Operating practice. Describes how this method is used in practice.MediumComplexity: medium. Estimates preparation, facilitation effort, and method confidence needed.Workshop + asyncFormat: workshop or async. Shows whether the method works in a workshop, asynchronously, or both.
Ongoing
2-12
Details
OperationsCategory: Operations. Describes the method's domain of use.
Asks its way step by step to a controllable cause and stops only once an effective countermeasure is within reach.
Core question: Which controllable cause behind the symptom can the team fix with a concrete countermeasure?
Analysis methodMethod form: Analysis method. Describes how this method is used in practice.LowComplexity: low. Estimates preparation, facilitation effort, and method confidence needed.WorkshopFormat: workshop. Shows whether the method works in a workshop, asynchronously, or both.
15-30 min
2-6
Details
Decision MakingCategory: Decision Making. Describes the method's domain of use.
Thinks through failure in advance to surface risks, countermeasures, and critical assumptions early.
Core question: Which plausible reasons could make this initiative fail at the assumed point, and how will we detect or reduce them?
Decision methodMethod form: Decision method. Describes how this method is used in practice.LowComplexity: low. Estimates preparation, facilitation effort, and method confidence needed.WorkshopFormat: workshop. Shows whether the method works in a workshop, asynchronously, or both.
20–45 min
Small cross-functional group
Details
InnovationCategory: Innovation. Describes the method's domain of use.
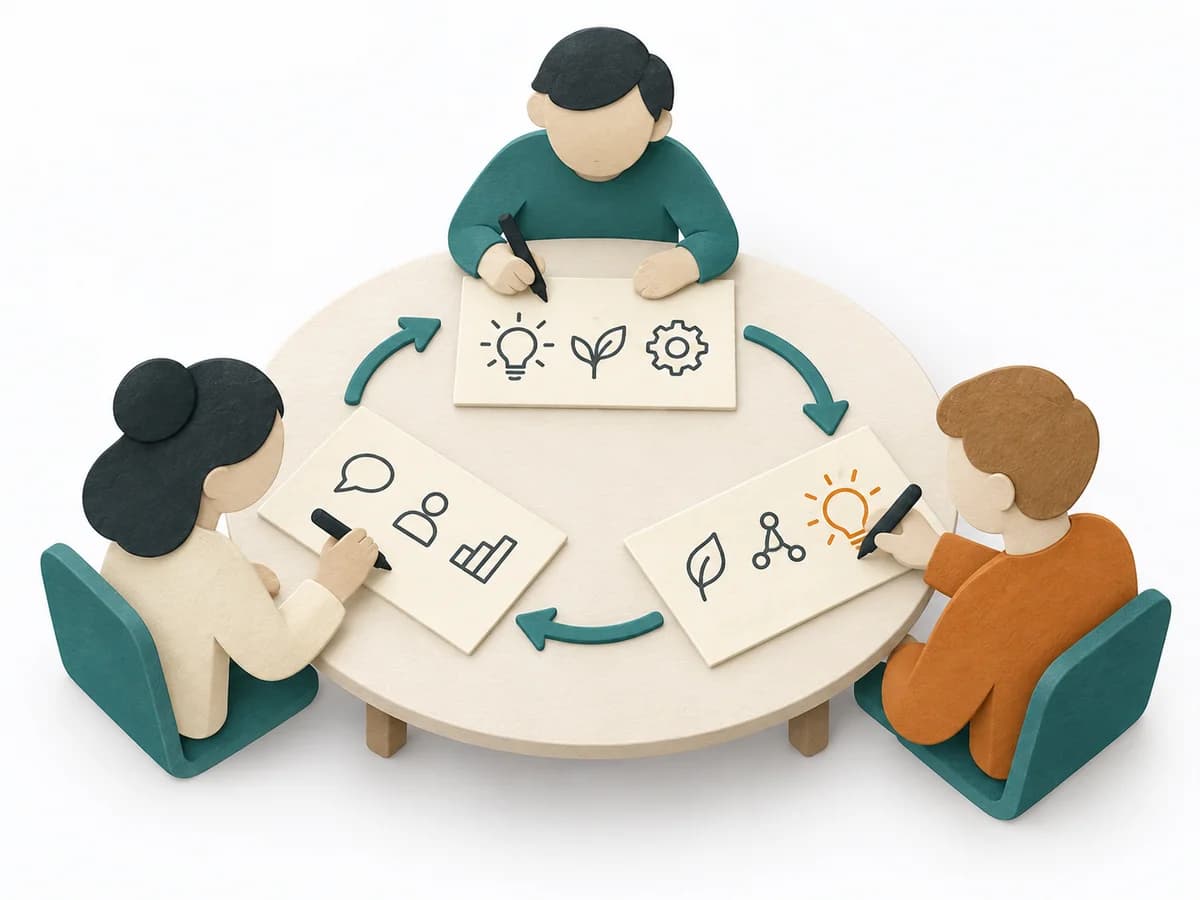
Gathers ideas silently and iteratively, builds on them together, and produces prioritized concepts instead of loud individual impulses.
Core question: What different ideas emerge when everyone writes silently first and then builds on others’ contributions?
Workshop methodMethod form: Workshop method. Describes how this method is used in practice.LowComplexity: low. Estimates preparation, facilitation effort, and method confidence needed.Workshop + asyncFormat: workshop or async. Shows whether the method works in a workshop, asynchronously, or both.
15-30 min
3-12
Details
Product StrategyCategory: Product Strategy. Describes the method's domain of use.
Condenses target group, problem, value proposition, and core assumptions into a lean picture for early product bets.
Core question: Which assumptions about problem, segment, solution, and economics must we test next?
CanvasMethod form: Canvas. Describes how this method is used in practice.MediumComplexity: medium. Estimates preparation, facilitation effort, and method confidence needed.Workshop + asyncFormat: workshop or async. Shows whether the method works in a workshop, asynchronously, or both.
45-90 min
1-6
Details
FacilitationCategory: Facilitation. Describes the method's domain of use.
Lets a group prioritize options with sticker dots, making preferences visible within minutes.
Core question: Which options merit further examination based on the group's independent preferences?
Decision methodMethod form: Decision method. Describes how this method is used in practice.LowComplexity: low. Estimates preparation, facilitation effort, and method confidence needed.WorkshopFormat: workshop. Shows whether the method works in a workshop, asynchronously, or both.
5-15 min
3-20
Details
Product StrategyCategory: Product Strategy. Describes the method's domain of use.
Converts goals into actors, behavior changes, and delivery options, showing which steps have leverage.
Core question: Why does the goal matter, who can influence it, how should behavior change and what could support it?
Mapping toolMethod form: Mapping tool. Describes how this method is used in practice.MediumComplexity: medium. Estimates preparation, facilitation effort, and method confidence needed.WorkshopFormat: workshop. Shows whether the method works in a workshop, asynchronously, or both.
45-90 min
3-8
Details
Decision MakingCategory: Decision Making. Describes the method's domain of use.
Sorts tasks by urgency and importance and turns them into a simple action decision.
Core question: What needs immediate action, scheduled attention, delegation, or removal from the active list?
Decision methodMethod form: Decision method. Describes how this method is used in practice.LowComplexity: low. Estimates preparation, facilitation effort, and method confidence needed.Workshop + asyncFormat: workshop or async. Shows whether the method works in a workshop, asynchronously, or both.
15-30 min
1-6
Details
Business StrategyCategory: Business Strategy. Describes the method's domain of use.
Compares internal strengths and weaknesses with external opportunities and threats, deriving option paths from it.
Core question: Which internal capabilities and external conditions shape our next strategic decision?
Analysis methodMethod form: Analysis method. Describes how this method is used in practice.LowComplexity: low. Estimates preparation, facilitation effort, and method confidence needed.WorkshopFormat: workshop. Shows whether the method works in a workshop, asynchronously, or both.
30-60 min
3-12
Details
Product StrategyCategory: Product Strategy. Describes the method's domain of use.
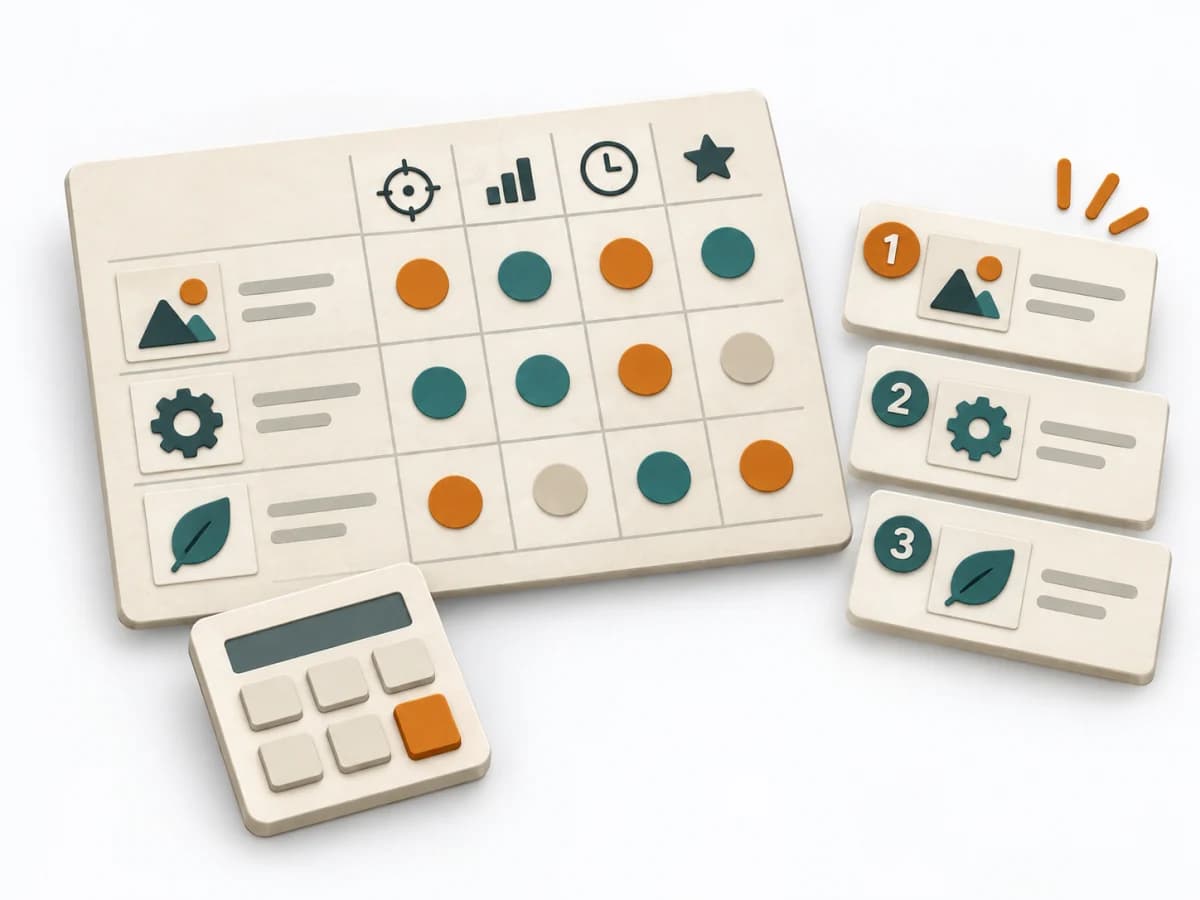
Scores initiatives by reach, impact, confidence, and effort, producing a sortable priority list.
Core question: Which initiative promises the greatest expected contribution to our goal relative to effort?
Decision methodMethod form: Decision method. Describes how this method is used in practice.MediumComplexity: medium. Estimates preparation, facilitation effort, and method confidence needed.Workshop + asyncFormat: workshop or async. Shows whether the method works in a workshop, asynchronously, or both.
60-90 min
2-10
Details
OperationsCategory: Operations. Describes the method's domain of use.
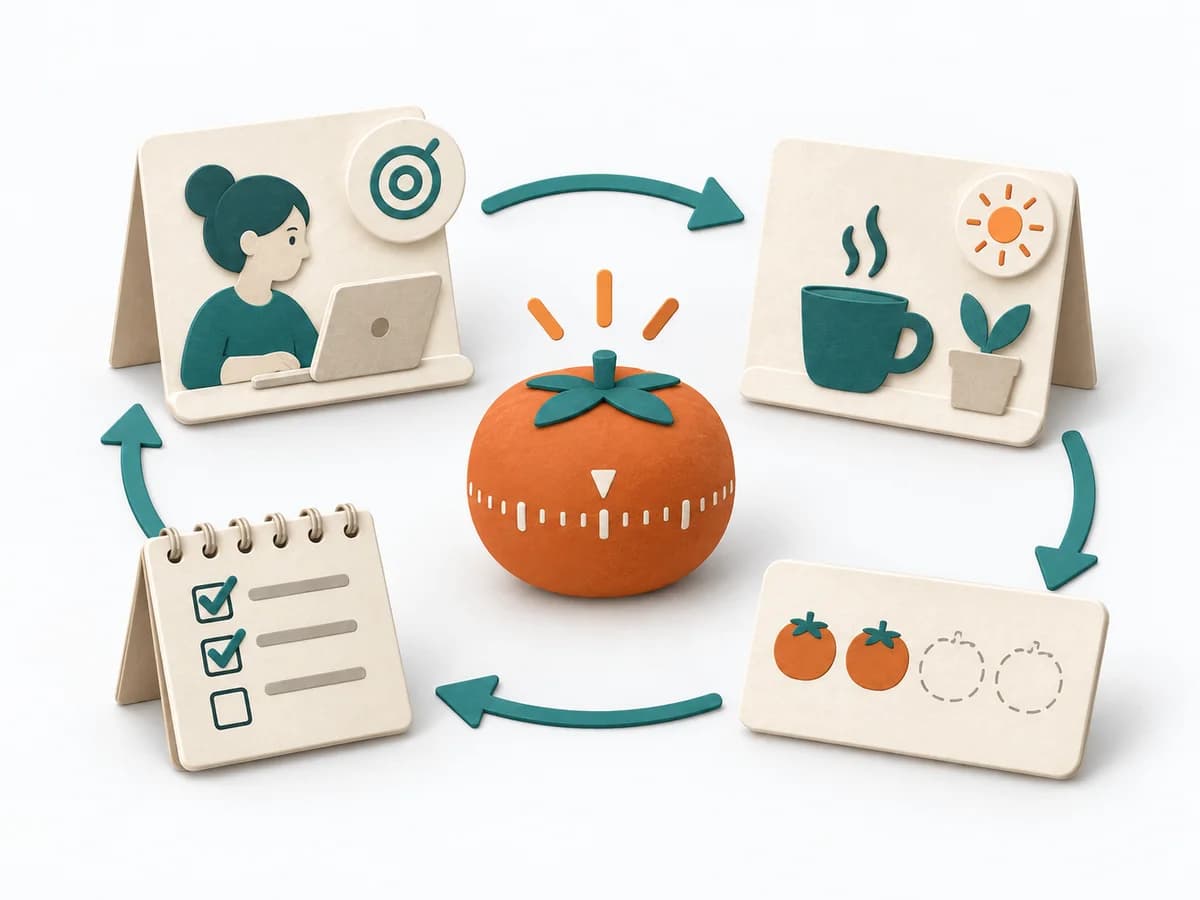
Splits focused work into short sprints with breaks and makes progress, interruptions, and energy use visible.
Core question: Which concrete task will I work on during the next uninterrupted interval?
Personal productivity methodMethod form: Personal productivity method. Describes how this method is used in practice.LowComplexity: low. Estimates preparation, facilitation effort, and method confidence needed.AsyncFormat: async. Shows whether the method works in a workshop, asynchronously, or both.
25 min Zyklen
1
Details
Systems ThinkingCategory: Systems Thinking. Describes the method's domain of use.
Maps value creation and evolution stages so strategic options, levers, and market movements become legible.
Core question: How does user need connect to components, and how evolved are they?
Mapping toolMethod form: Mapping tool. Describes how this method is used in practice.MediumComplexity: medium. Estimates preparation, facilitation effort, and method confidence needed.Workshop + asyncFormat: workshop or async. Shows whether the method works in a workshop, asynchronously, or both.
1-3 h
2-10
Details
FacilitationCategory: Facilitation. Describes the method's domain of use.
Compares three perspectives in a shared picture and makes overlaps as visible as differences.
Core question: Which elements belong to exactly one, two or all three sets?
Mapping toolMethod form: Mapping tool. Describes how this method is used in practice.LowComplexity: low. Estimates preparation, facilitation effort, and method confidence needed.Workshop + asyncFormat: workshop or async. Shows whether the method works in a workshop, asynchronously, or both.
15-45 min
2-8
Details
OperationsCategory: Operations. Describes the method's domain of use.
Coordinates team, immediate actions, root cause analysis, and prevention across eight steps to a verified solution.
Core question: How will we safely contain a material problem, permanently remove verified occurrence and detection causes, and prevent similar cases?
Process modelMethod form: Process model. Describes how this method is used in practice.HighComplexity: high. Estimates preparation, facilitation effort, and method confidence needed.Workshop + asyncFormat: workshop or async. Shows whether the method works in a workshop, asynchronously, or both.
1-6 Wochen
4-10
Details
GrowthCategory: Growth. Describes the method's domain of use.
Tests variants under controlled conditions, keeps the decision log clean, and summarizes results in a learning summary.
Core question: Does B produce the pre-defined meaningful effect over A without breaching guardrails?
Research methodMethod form: Research method. Describes how this method is used in practice.HighComplexity: high. Estimates preparation, facilitation effort, and method confidence needed.AsyncFormat: async. Shows whether the method works in a workshop, asynchronously, or both.
1-4 Wochen
1-6
Details
OperationsCategory: Operations. Describes the method's domain of use.
Condenses problem, analysis, countermeasures, and follow-up onto one sheet and forces joint analysis.
Core question: Which gap between current and target condition is evidenced, and which countermeasure will we test first?
Operating practiceMethod form: Operating practice. Describes how this method is used in practice.MediumComplexity: medium. Estimates preparation, facilitation effort, and method confidence needed.Workshop + asyncFormat: workshop or async. Shows whether the method works in a workshop, asynchronously, or both.
45-90 min
2-5
Details
OperationsCategory: Operations. Describes the method's domain of use.
Splits items into A, B, and C by value or effect and directs focus to the most impactful ones.
Core question: What level of control does each item need given its value contribution?
Decision methodMethod form: Decision method. Describes how this method is used in practice.LowComplexity: low. Estimates preparation, facilitation effort, and method confidence needed.AsyncFormat: async. Shows whether the method works in a workshop, asynchronously, or both.
30-60 min
1-5
Details
UX ResearchCategory: UX Research. Describes the method's domain of use.
Clusters notes into themes, statements, and opportunities, translating raw material into clear implications.
Core question: What patterns emerge from individual notes, which outliers matter, and what question follows?
Analysis methodMethod form: Analysis method. Describes how this method is used in practice.LowComplexity: low. Estimates preparation, facilitation effort, and method confidence needed.WorkshopFormat: workshop. Shows whether the method works in a workshop, asynchronously, or both.
45–90 min
3-10
Details
Business StrategyCategory: Business Strategy. Describes the method's domain of use.
Clarifies starting point, opportunities, and strategic options by defining products and markets, collecting growth options, and choosing focus options.
Core question: Which product-market direction offers viable growth with explicit risk and suitable capabilities?
Analysis methodMethod form: Analysis method. Describes how this method is used in practice.LowComplexity: low. Estimates preparation, facilitation effort, and method confidence needed.Workshop + asyncFormat: workshop or async. Shows whether the method works in a workshop, asynchronously, or both.
45-90 min
2-8
Details
ArchitectureCategory: Architecture. Describes the method's domain of use.
Structures architecture knowledge across goals, context, runtime, and deployment into living system documentation.
Core question: What system context, constraints, and decisions must the architecture communicate?
Planning toolMethod form: Planning tool. Describes how this method is used in practice.LowComplexity: low. Estimates preparation, facilitation effort, and method confidence needed.Workshop + asyncFormat: workshop or async. Shows whether the method works in a workshop, asynchronously, or both.
1-2 Tage
1-4
Details
ArchitectureCategory: Architecture. Describes the method's domain of use.
Documents an architecture decision with context, alternatives, and consequences so later reviews remain traceable.
Core question: Which architecture decision are we making in this context, why choose it and which consequences does it carry?
Decision methodMethod form: Decision method. Describes how this method is used in practice.LowComplexity: low. Estimates preparation, facilitation effort, and method confidence needed.AsyncFormat: async. Shows whether the method works in a workshop, asynchronously, or both.
15-45 min
1-3
Details
ArchitectureCategory: Architecture. Describes the method's domain of use.
Examines how architecture decisions support important quality goals and makes risks and trade-offs visible.
Core question: How does the architecture support our most important quality goals, and where do risks or trade-offs arise?
Analysis methodMethod form: Analysis method. Describes how this method is used in practice.HighComplexity: high. Estimates preparation, facilitation effort, and method confidence needed.Workshop + asyncFormat: workshop or async. Shows whether the method works in a workshop, asynchronously, or both.
Several meetings plus preparation and analysis; total effort depends on scope
Evaluation team, architects, and relevant stakeholders
Details
Business StrategyCategory: Business Strategy. Describes the method's domain of use.
Links perspectives, metrics, and initiatives into a scorecard that makes strategy traceable in daily work.
Core question: How does our strategy create intended financial or stakeholder value through capabilities, processes and customer outcomes?
FrameworkMethod form: Framework. Describes how this method is used in practice.HighComplexity: high. Estimates preparation, facilitation effort, and method confidence needed.Workshop + asyncFormat: workshop or async. Shows whether the method works in a workshop, asynchronously, or both.
Halber Tag bis mehrere Wochen
4-12
Details
DevOpsCategory: DevOps. Describes the method's domain of use.
Reconstructs an incident without assigning blame and translates causes into concrete improvement actions.
Core question: Which conditions enabled the incident, and how do we reduce recurrence or impact?
Operating practiceMethod form: Operating practice. Describes how this method is used in practice.MediumComplexity: medium. Estimates preparation, facilitation effort, and method confidence needed.Workshop + asyncFormat: workshop or async. Shows whether the method works in a workshop, asynchronously, or both.
30-90 min
3-12
Details
Business StrategyCategory: Business Strategy. Describes the method's domain of use.
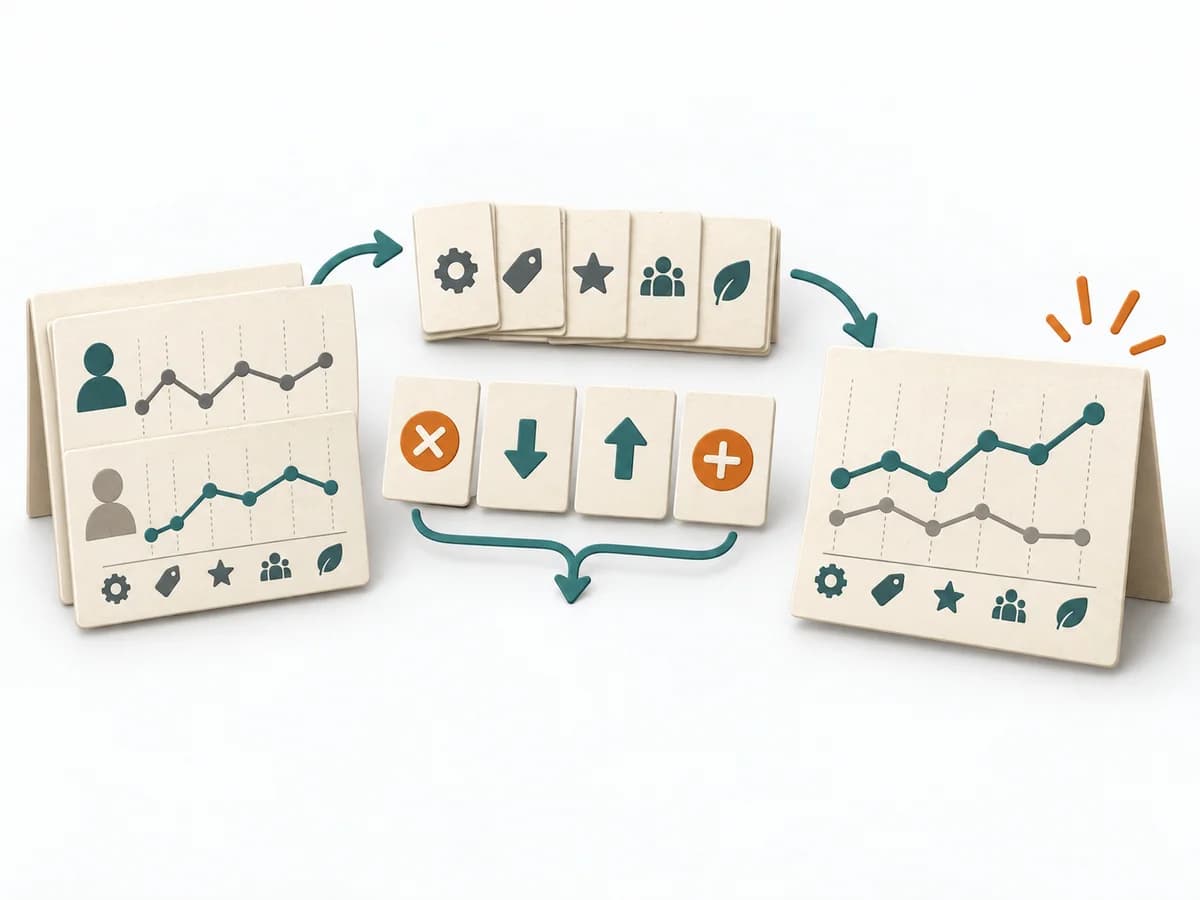
Clarifies starting point, opportunities, and strategic options by defining the competitive factors, drawing the current value curve, and testing a new value curve.
Core question: Which factors should we eliminate, reduce, raise or create to produce a distinctly different value curve?
CanvasMethod form: Canvas. Describes how this method is used in practice.MediumComplexity: medium. Estimates preparation, facilitation effort, and method confidence needed.WorkshopFormat: workshop. Shows whether the method works in a workshop, asynchronously, or both.
2-4 h
3-10
Details
InnovationCategory: Innovation. Describes the method's domain of use.
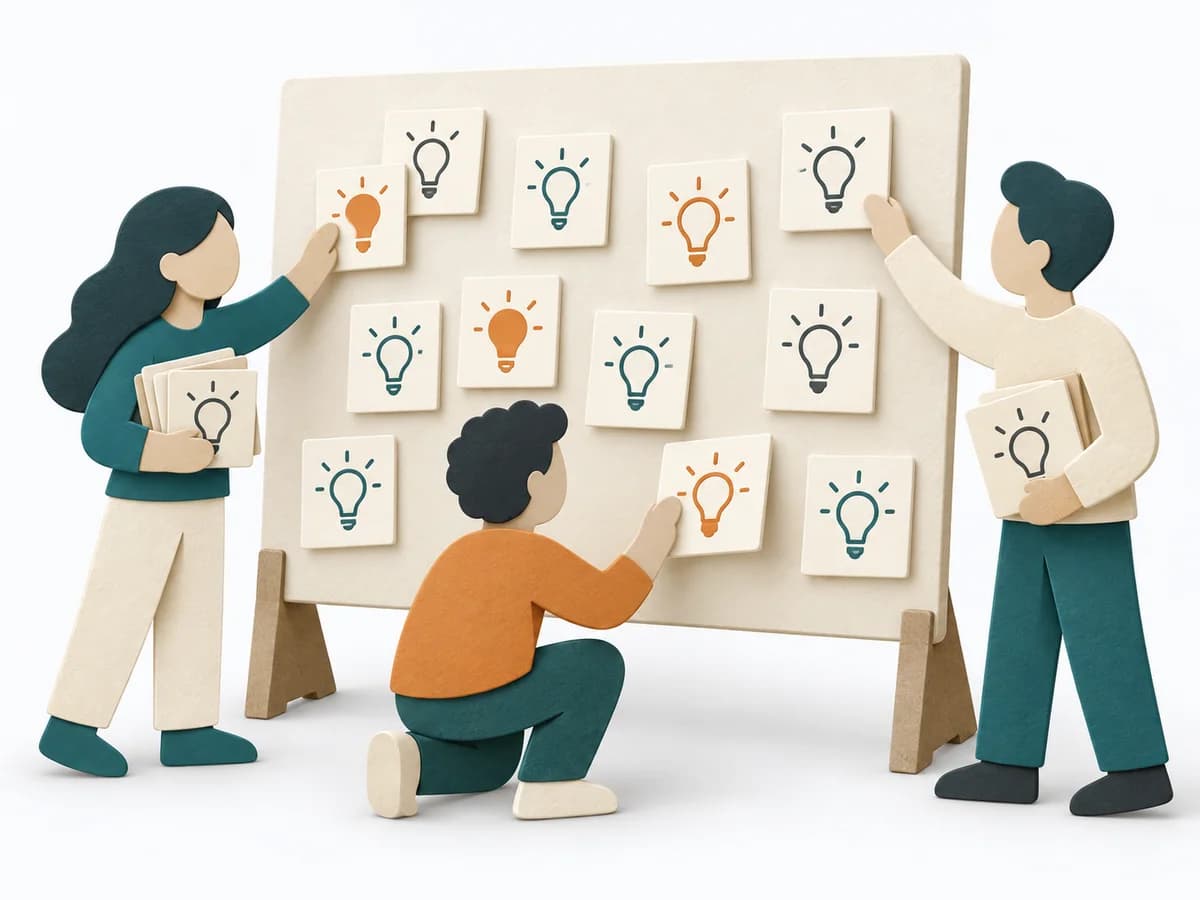
Opens the idea space, bundles contributions into theme clusters, and condenses them into a shortlist for the next step.
Core question: Which ideas could address the defined challenge?
Workshop methodMethod form: Workshop method. Describes how this method is used in practice.LowComplexity: low. Estimates preparation, facilitation effort, and method confidence needed.WorkshopFormat: workshop. Shows whether the method works in a workshop, asynchronously, or both.
30-60 min
4-12
Details
ArchitectureCategory: Architecture. Describes the method's domain of use.
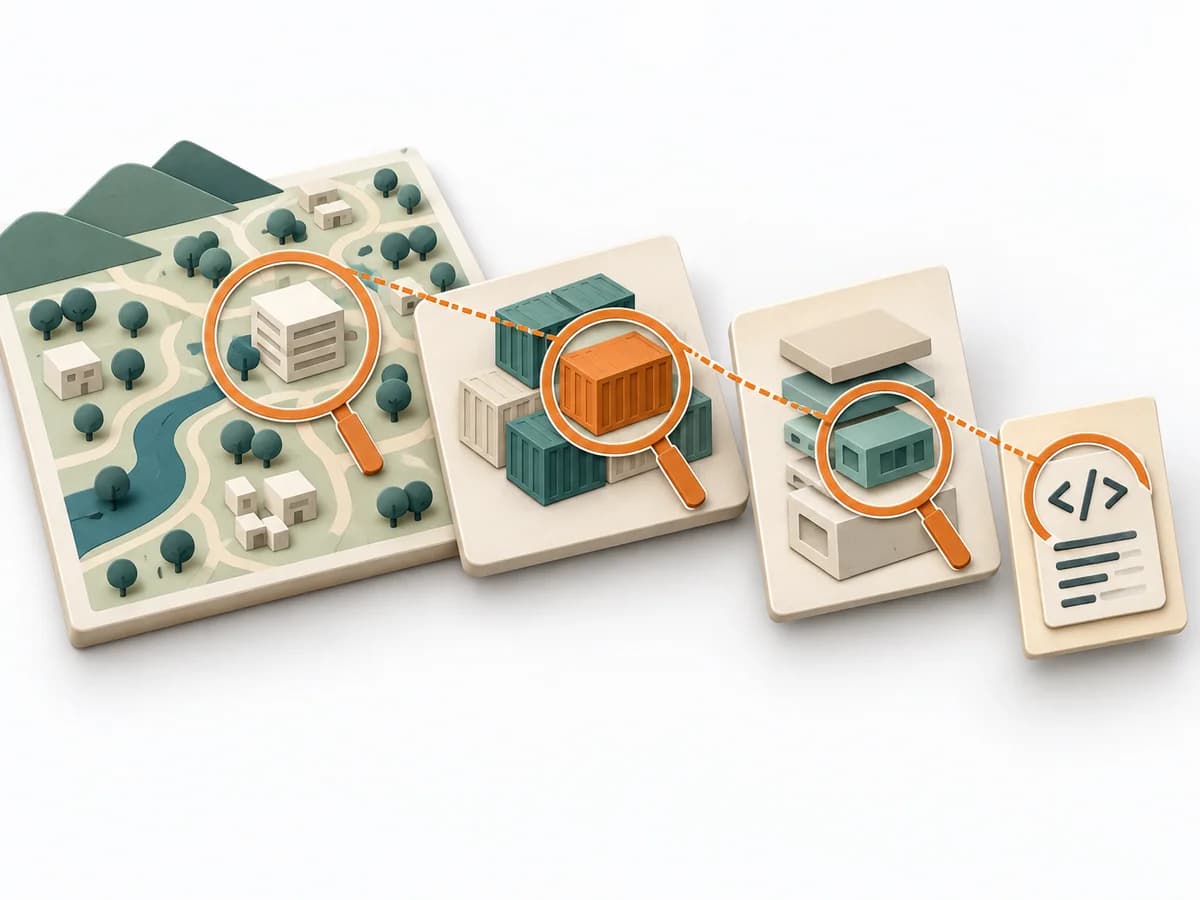
Makes system, container, and building blocks legible in graduated views, easing architecture communication.
Core question: Which diagrams let each audience understand the software architecture?
Mapping toolMethod form: Mapping tool. Describes how this method is used in practice.LowComplexity: low. Estimates preparation, facilitation effort, and method confidence needed.Workshop + asyncFormat: workshop or async. Shows whether the method works in a workshop, asynchronously, or both.
1-4 h
1-5
Details
UX ResearchCategory: UX Research. Describes the method's domain of use.
Shows how people group and name content so content groups, labels, and IA hypotheses become grounded.
Core question: Which content groups and terms fit the mental models of the relevant audience?
Research methodMethod form: Research method. Describes how this method is used in practice.LowComplexity: low. Estimates preparation, facilitation effort, and method confidence needed.Workshop + asyncFormat: workshop or async. Shows whether the method works in a workshop, asynchronously, or both.
20-45 min
Based on research question
Details
DeliveryCategory: Delivery. Describes the method's domain of use.
Defines audiences, channels, frequencies, and owners so relevant information reliably gets through.
Core question: Who needs which information when, from whom and through which feedback channel?
Planning toolMethod form: Planning tool. Describes how this method is used in practice.LowComplexity: low. Estimates preparation, facilitation effort, and method confidence needed.Workshop + asyncFormat: workshop or async. Shows whether the method works in a workshop, asynchronously, or both.
45-90 min
2-6
Details
Knowledge ModelingCategory: Knowledge Modeling. Describes the method's domain of use.
Clarifies concepts, relationships, and rules by framing the focus question, gathering concepts, and checking gaps and contradictions.
Core question: Which concepts and propositions answer our focus question?
Mapping toolMethod form: Mapping tool. Describes how this method is used in practice.MediumComplexity: medium. Estimates preparation, facilitation effort, and method confidence needed.Workshop + asyncFormat: workshop or async. Shows whether the method works in a workshop, asynchronously, or both.
1-2 h
1-8
Details
Domain ModelingCategory: Domain Modeling. Describes the method's domain of use.
Shows relationships between business contexts and makes integration patterns, dependencies, and friction points visible.
Core question: Which models apply where, and how do contexts influence one another when collaborating?
Mapping toolMethod form: Mapping tool. Describes how this method is used in practice.MediumComplexity: medium. Estimates preparation, facilitation effort, and method confidence needed.Workshop + asyncFormat: workshop or async. Shows whether the method works in a workshop, asynchronously, or both.
1-3 h
2-8
Details
UX ResearchCategory: UX Research. Describes the method's domain of use.
Observes real work in context and pairs it with follow-up questions to capture workflow insights precisely.
Core question: How do people perform real work in context, and which interruptions or adaptations become visible?
Research methodMethod form: Research method. Describes how this method is used in practice.MediumComplexity: medium. Estimates preparation, facilitation effort, and method confidence needed.Workshop + asyncFormat: workshop or async. Shows whether the method works in a workshop, asynchronously, or both.
1-3 Wochen
4-12 Beobachtungen
Details
InnovationCategory: Innovation. Describes the method's domain of use.
Forces eight sketches in a short time so direction options emerge and favorites become quickly comparable.
Core question: What different visual directions could address the focused design challenge?
Workshop methodMethod form: Workshop method. Describes how this method is used in practice.LowComplexity: low. Estimates preparation, facilitation effort, and method confidence needed.WorkshopFormat: workshop. Shows whether the method works in a workshop, asynchronously, or both.
8-15 min
1-10
Details
Systems ThinkingCategory: Systems Thinking. Describes the method's domain of use.
Clarifies connections, patterns, and leverage points by collecting undesirable effects, formulating causal links, and deriving interventions.
Core question: Which common causes can sufficiently explain the observed undesirable effects?
Mapping toolMethod form: Mapping tool. Describes how this method is used in practice.HighComplexity: high. Estimates preparation, facilitation effort, and method confidence needed.WorkshopFormat: workshop. Shows whether the method works in a workshop, asynchronously, or both.
2-6 h
3-8
Details
Decision MakingCategory: Decision Making. Describes the method's domain of use.
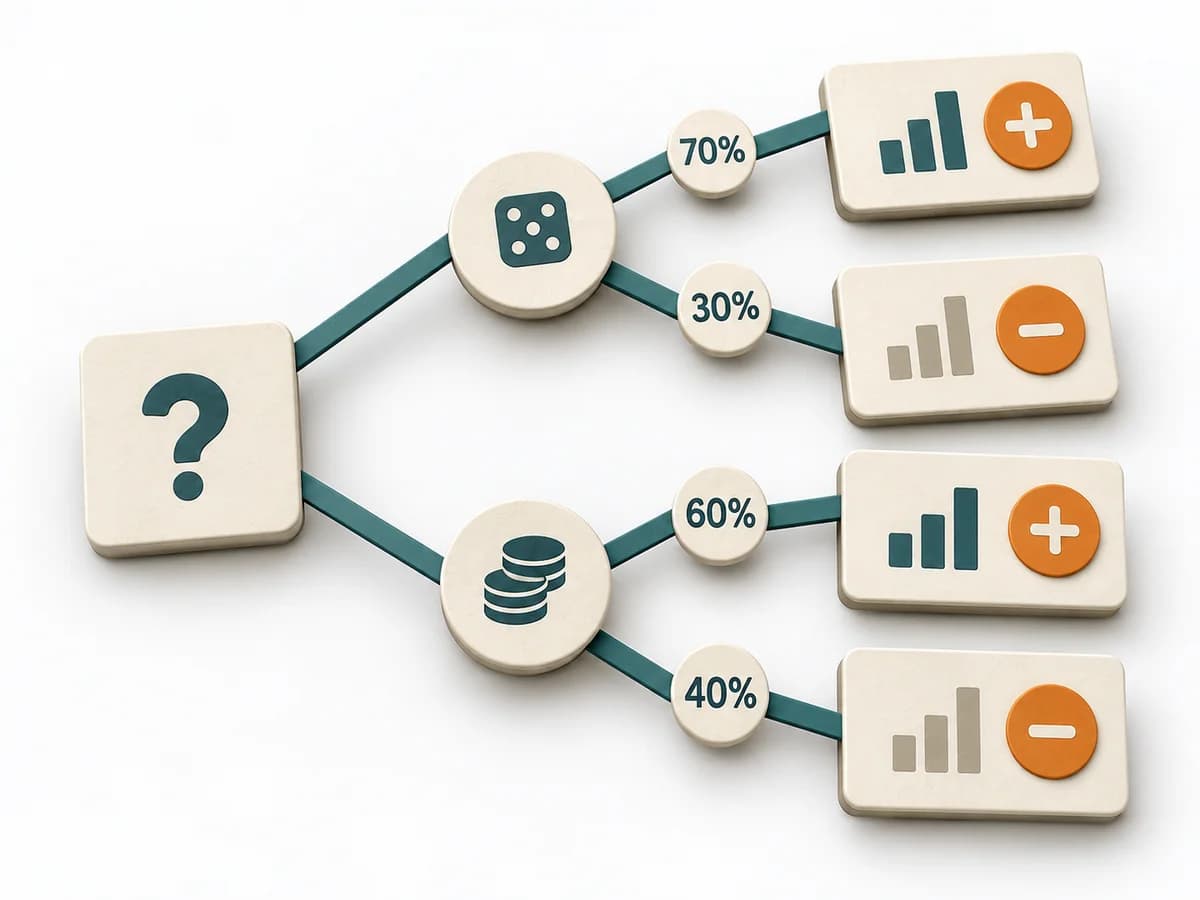
Draws decisions as branching paths so options, conditions, and consequences become clearer in comparison.
Core question: Which actions and uncertainties lead to which outcomes, and what assumptions support the choice?
Decision methodMethod form: Decision method. Describes how this method is used in practice.MediumComplexity: medium. Estimates preparation, facilitation effort, and method confidence needed.Workshop + asyncFormat: workshop or async. Shows whether the method works in a workshop, asynchronously, or both.
30-90 min
1-6
Details
Decision MakingCategory: Decision Making. Describes the method's domain of use.
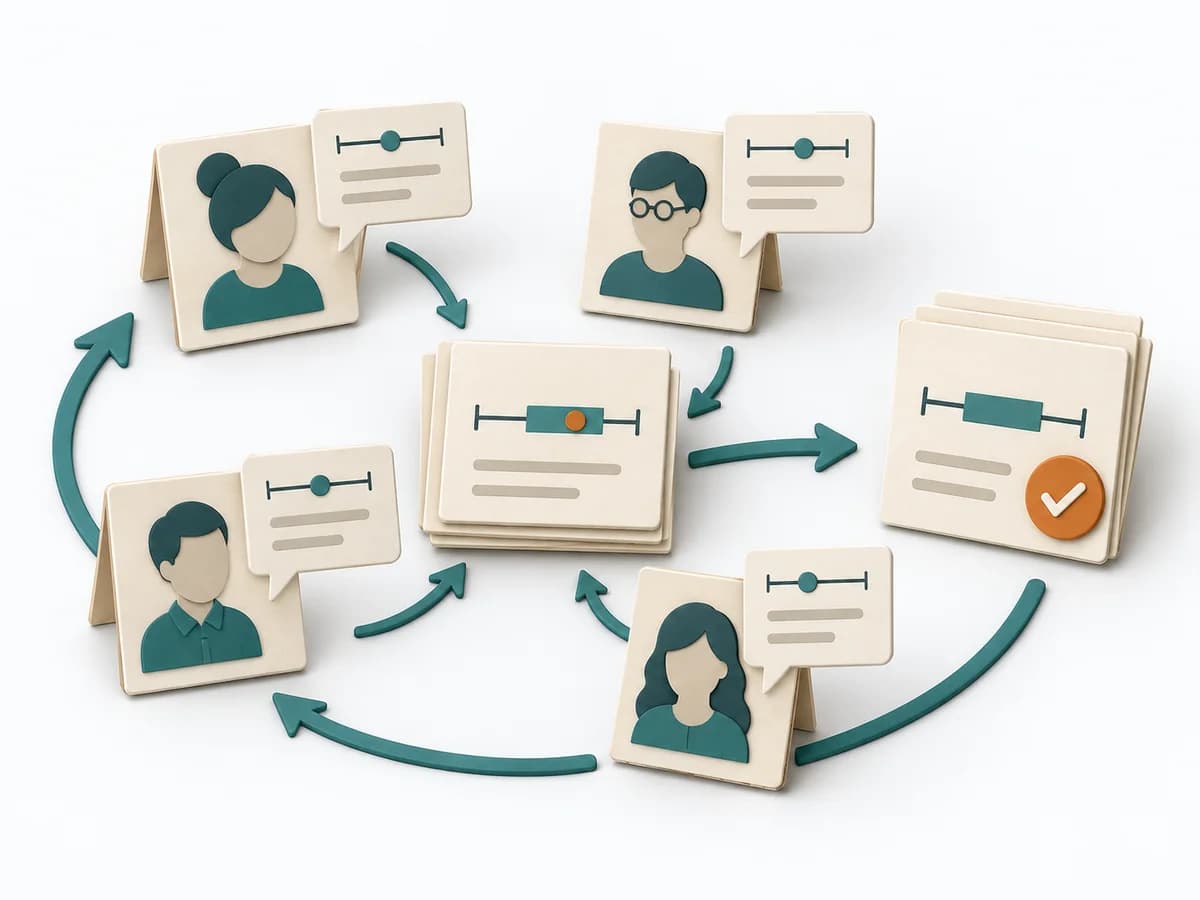
Bundles expert estimates across rounds until ranges, consensus, and assumptions become solid enough.
Core question: What share of our customers will require digital evidence by the end of 2028?
Decision methodMethod form: Decision method. Describes how this method is used in practice.HighComplexity: high. Estimates preparation, facilitation effort, and method confidence needed.AsyncFormat: async. Shows whether the method works in a workshop, asynchronously, or both.
1-4 Wochen
6-30 Experten
Details
OperationsCategory: Operations. Describes the method's domain of use.
Guides improvement work from problem definition through measurement and analysis to controls and lasting transfer.
Core question: How will we improve an existing process through valid measurement, confirmed drivers, and sustainably controlled changes?
Process modelMethod form: Process model. Describes how this method is used in practice.HighComplexity: high. Estimates preparation, facilitation effort, and method confidence needed.Workshop + asyncFormat: workshop or async. Shows whether the method works in a workshop, asynchronously, or both.
2-12 Wochen
3-10
Details
Favorites
Favorites are stored locally in the browser and appear through the favorites filter in the catalog.