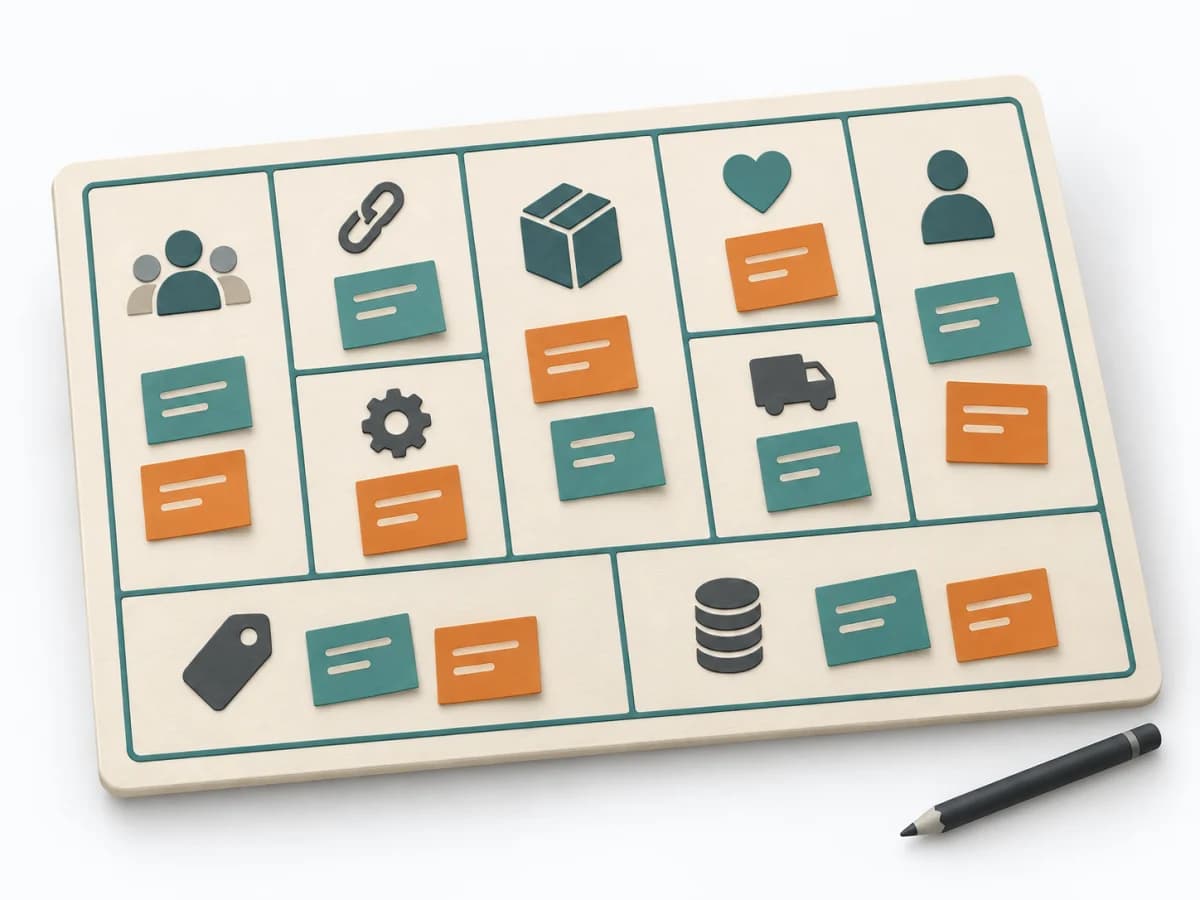

Purpose
The Blue Ocean Strategy Canvas shows how an offering is positioned relative to the market. Differentiation thereby becomes tangible in value factors instead of merely being claimed.
Business Strategy Canvas
The Strategy Canvas visualises an industry’s competitive logic as value curves and supports a focused, divergent buyer-value profile.
The Strategy Canvas plots key competing factors on the horizontal axis and relative offering level on the vertical axis. Current curves reveal convergence; Eliminate, Reduce, Raise, and Create structure a new curve with focus, divergence, and a clear strategic profile.
Which factors should we eliminate, reduce, raise or create to produce a distinctly different value curve?
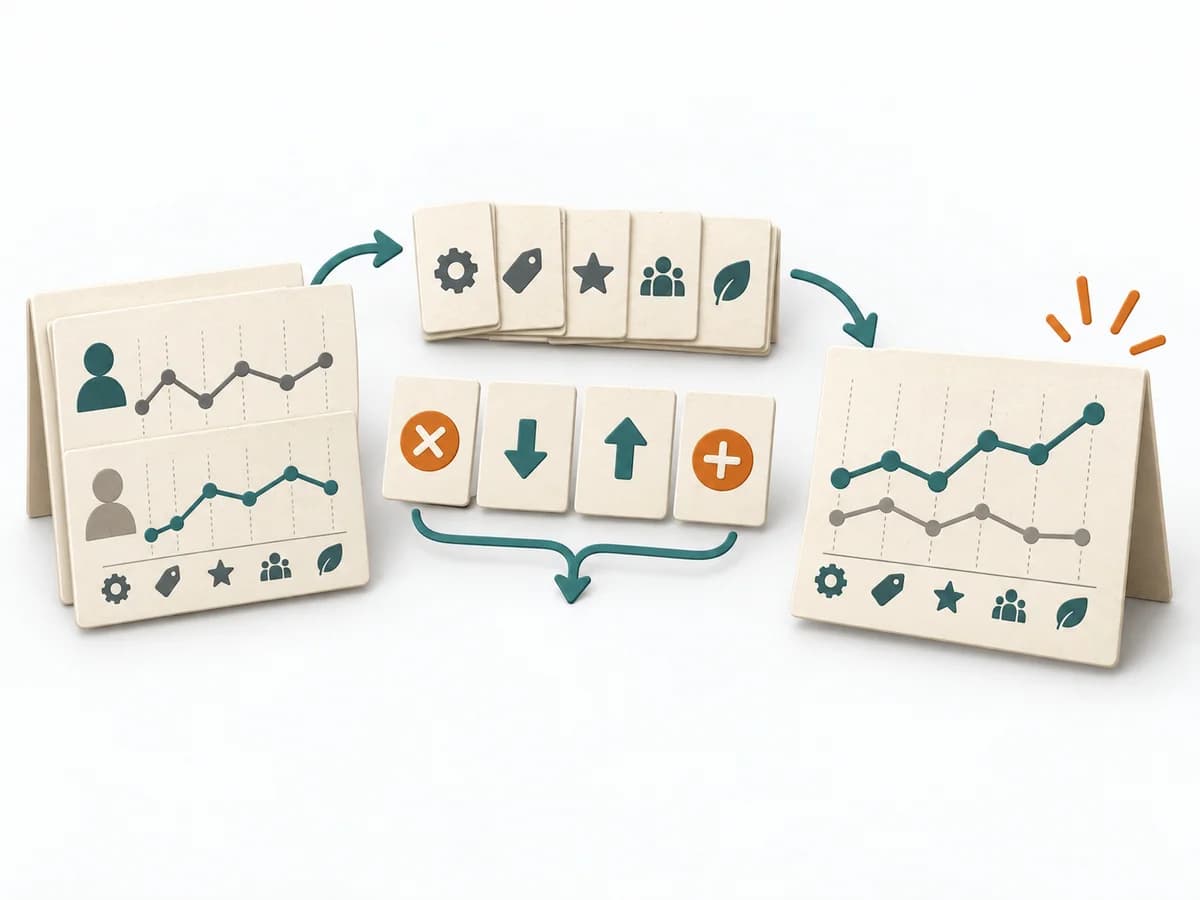
Factors
Name the purchase- and cost-relevant factors of the industry from the buyer view.
Current curves
Plot industry, current offer and alternatives on the same relative scale.
ERRC
Eliminate, reduce or raise industry factors and create new ones.
Target curve
Translate ERRC choices into a focused, clearly divergent target profile.
Validate
Test critical value, cost and feasibility assumptions before major investment.
Test factors and curves with customer, noncustomer and cost evidence; revise the target curve after experiments.
For strategic repositioning and value innovation when industry offers compete along similar factors.
Comparable current and target curves across buyer-relevant factors.
Eliminate, Reduce, Raise and Create choices with assumptions, tests and thresholds.
Fictional example
Rows are competing factors; columns separate industry pattern, current offer, target profile and ERRC choice.
| Competing factor | Industry pattern | Current offer | Target profile | ERRC |
|---|---|---|---|---|
| Course breadthWhat relative level do market, current and target offer? | high | high | low | Reduce |
| Live supportWhat relative level do market, current and target offer? | low | low | high | Raise |
| AuditabilityWhat relative level do market, current and target offer? | medium | low | high | Raise |
| Practice pathwaysWhat relative level do market, current and target offer? | low | low | high | Create |
Relative values reveal patterns and are not an objective measurement scale.
Bound the market and buyer perspective; prepare evidence on competing factors and relative offering levels.
The Blue Ocean Strategy Canvas shows how an offering is positioned relative to the market. Differentiation thereby becomes tangible in value factors instead of merely being claimed.
The team lists the relevant competitive factors and plots both its own and competitors' positioning. Factors are then reduced, raised, created, or eliminated to develop a distinct value curve. This produces a strategic comparison that makes innovation concrete.
The Blue Ocean Strategy Canvas works because it makes competitive factors, industry norms, and possible differentiation visible on a comparison curve. Its usefulness increases when customer relevance, cost impact, and deliberate trade-off decisions are considered together. What matters most is genuinely questioning familiar factors and naming new value drivers concretely, so the canvas produces a credible strategic realignment.
Prepare the most important competitive patterns and industry-typical value propositions before drawing the curves. The most leveraged point comes where the team would have to lower or cut a valued factor to make room for something new. Close with a clear target curve and a few assumptions to be tested in the market.
The method guide walks execution through 5 phases, timing, 5 pitfalls, and clear stop criteria.
Open method guideYour perspective
Your feedback helps shape the next improvements to methodatlas.
Bound the market and buyer perspective; prepare evidence on competing factors and relative offering levels.
To be confirmed
To be confirmed
Complete workflow Time: 3–5 hours plus research and market validation
Complete this worksheet on paper or in your own document during the work.
| Competing factor | Industry pattern | Current offer | Target profile | Eliminate, Reduce, Raise or Create |
|---|---|---|---|---|
| Course breadth | ||||
| Live support | ||||
| Auditability | ||||
| Practice pathways |
Write factors from the buyer perspective. Use one relative scale and mark estimates.
Blue Ocean Strategy: Strategy Canvas
Expected artifact: Ordered factor axis
Concrete, distinct factors
Entry:
...
Expected artifact: Current value curves
Factor values, source and uncertainty
Entry:
...
Expected artifact: ERRC Grid
Action, rationale, effect and assumption
Entry:
...
Expected artifact: Target value curve
Target levels and strategic tagline
Entry:
...
Expected artifact: Validation plan
Assumption, test, threshold and consequence
Entry:
...
...
Method guide: https://methodatlas.meierhoff-systems.de/en/methods/blue-ocean-strategy-canvas/run-sheet
Fitting alternatives with decision guidance, followed by other related methods.

Instead of Blue Ocean Strategy Canvas, choose Value Proposition Canvas when you want to align value propositions and customer jobs with each other.

Clarifies starting point, opportunities, and strategic options by defining products and markets, collecting growth options, and choosing focus options.

Structures current business, emerging growth fields, and future options across three horizons so portfolio decisions can balance today, tomorrow, and later.

Moves the current situation, opportunities, and strategic options toward a concrete result through "explain the nine-activity template", "describe primary activities", and "derive levers and weaknesses".

Compares internal strengths and weaknesses with external opportunities and threats, deriving option paths from it.

Clarifies starting point, opportunities, and strategic options by defining the scope and market, gathering factors by category, and formulating strategic questions.