Purpose
When features need to be distinguished by their effect on satisfaction, it makes expectations and surprises comparable. It separates basic needs, performance contribution, and delight.
Product Discovery Decision method
Classifies product attributes by how their presence and absence affect customer satisfaction, using paired questions.
Classifies product attributes by how their presence and absence affect customer satisfaction, using paired questions.
How does each feature affect satisfaction when present or absent?
The steps are a practical sequence; adapt them to the method’s purpose and available evidence.
Features
Break concepts into attributes respondents can evaluate independently and understand consistently.
Functional
For each attribute ask how respondents feel if it is present. Use the same five options: like it; must be that way; neutral; can live with it; dislike it.
Dysfunctional
Ask the mirrored question for the feature’s absence; keep both answers paired for each respondent.
Analysis
Classify each pair as A/O/M/I/R/Q, aggregate frequencies and investigate Q, reverse, ties and segments.
Revisit the model when evidence, context or outcomes change. Record what changed and why.
Use it when: Feature Strategy, Roadmap Tradeoffs. The group can provide the evidence and authority the method requires.
Paired answers per feature, evaluation table and distribution of A/O/M/I/R/Q categories.
Recorded scope, date, participants, source version, owner, changed assumptions, and the reason for each revision.
Example responses per feature
Record both answers from the same respondent for each feature; then classify them using the Kano evaluation table.
| Feature and response pair | Feature | Functional | Dysfunctional | Category |
|---|---|---|---|---|
| Response pair 1Record one respondent’s answers for one feature | Reschedule online | Like it | Dislike | O · One-dimensional |
| Response pair 2Record one respondent’s answers for one feature | Choose reminder time | Like it | Neutral | A · Attractive |
The matrix records each respondent’s functional and dysfunctional answer together. The canonical A/O/M/I/R/Q evaluation table appears in the method example.
Break concepts into attributes respondents can evaluate independently and understand consistently.
When features need to be distinguished by their effect on satisfaction, it makes expectations and surprises comparable. It separates basic needs, performance contribution, and delight.
It classifies answers to functional questions so that basic, performance, and delight factors become legible on the same grid. This lets roadmap decisions align more with customer experience than with sheer feature count.
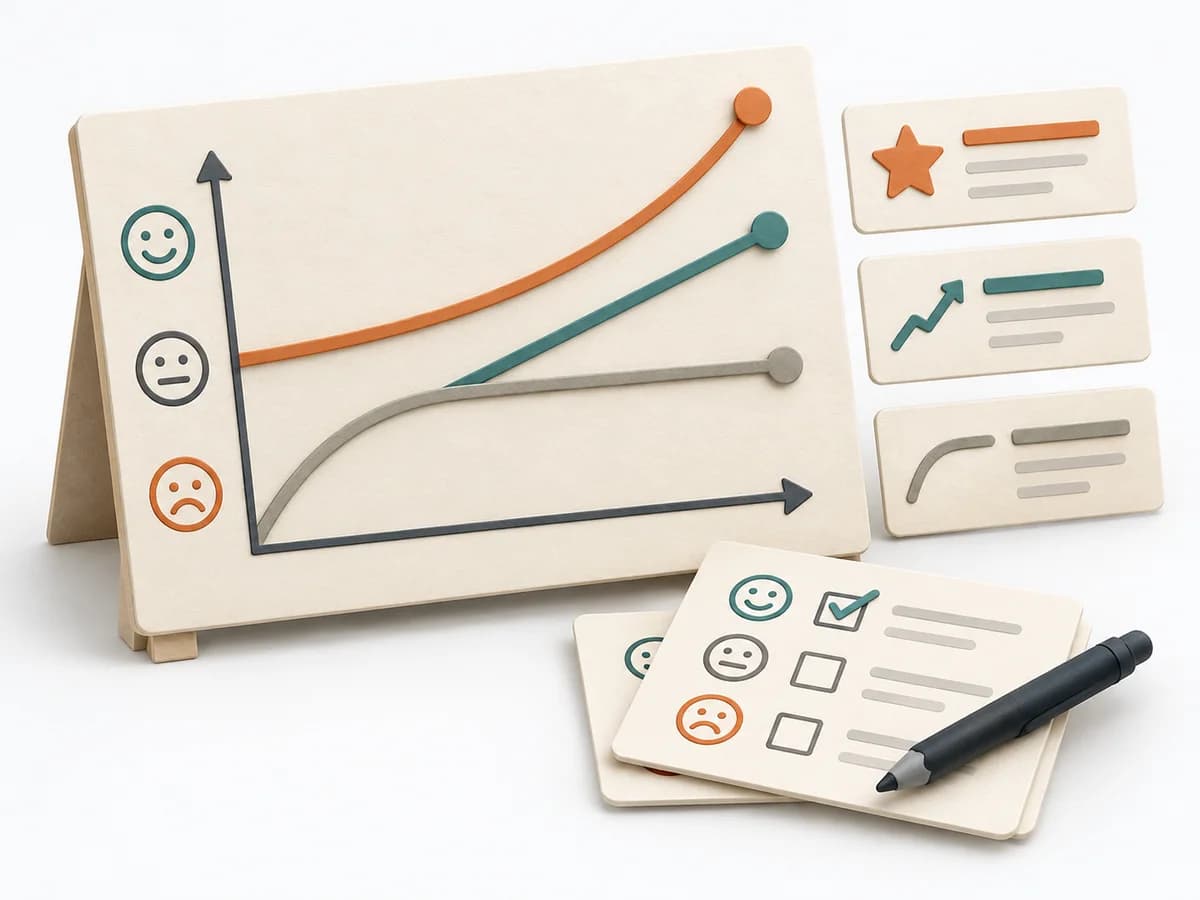
The Kano Model works because it distinguishes features by their effect on satisfaction, breaking up linear prioritization logic. Good use looks at the reaction to a feature's presence and absence instead of merely asking about importance. This reveals which features only meet expectations, which can delight, and which investment brings hardly any additional effect.
Prepare a manageable set of clearly worded features so respondents or participants don't answer with bundled solutions. The decision becomes solid once a feature the team considers a delighter shows only basic-need behavior in the responses. Close with a clear classification and a note on which features need further evidence or segmentation.
The method guide walks execution through 4 phases, timing, 4 pitfalls, and clear stop criteria.
Open method guideYour perspective
Your feedback helps shape the next improvements to methodatlas.
Prepare the decision, source evidence and next review.
To be confirmed
To be confirmed
Run the method Time: See catalog planning range; no universal duration.
Complete this worksheet on paper or in your own document during the work.
| Feature and response pair | Feature | Functional | Dysfunctional | Category |
|---|---|---|---|---|
| Response pair 1 | ||||
| Response pair 2 |
Keep each respondent’s paired answers together. Do not replace this evaluation with a feature popularity score.
Attractive Quality and Must-Be Quality · Kano et al. (1984)
Expected artifact: Atomic attribute list
Atomic attribute list
Entry:
...
Expected artifact: Functional answer per respondent and feature
Functional answer per respondent and feature
Entry:
...
Expected artifact: Complete answer pairs
Complete answer pairs
Entry:
...
Expected artifact: Category distribution with uncertainty
Category distribution with uncertainty
Entry:
...
...
Method guide: https://methodatlas.meierhoff-systems.de/en/methods/kano/run-sheet
Fitting alternatives with decision guidance, followed by other related methods.
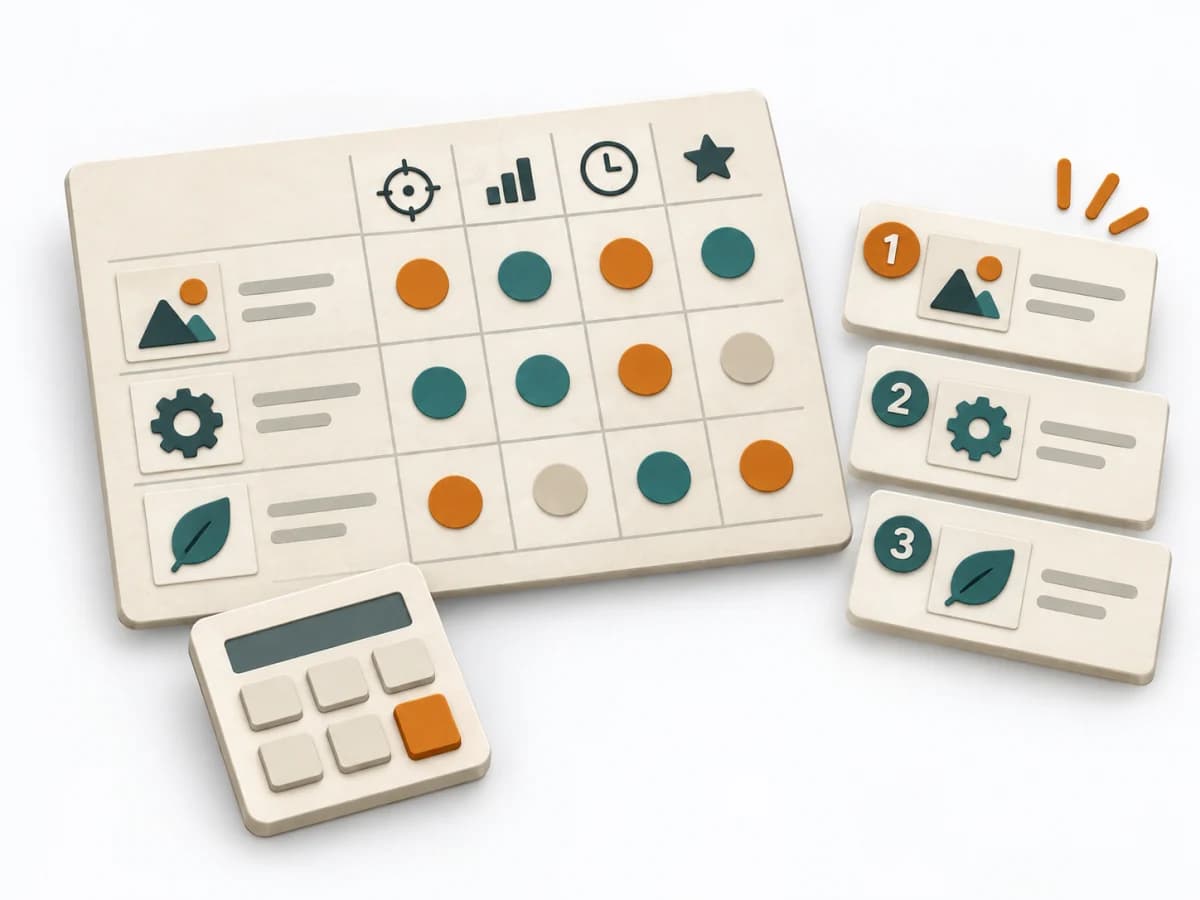
Instead of Kano Model, when reach, impact, confidence, and effort should count as a numeric comparison and no expectation categories are needed.
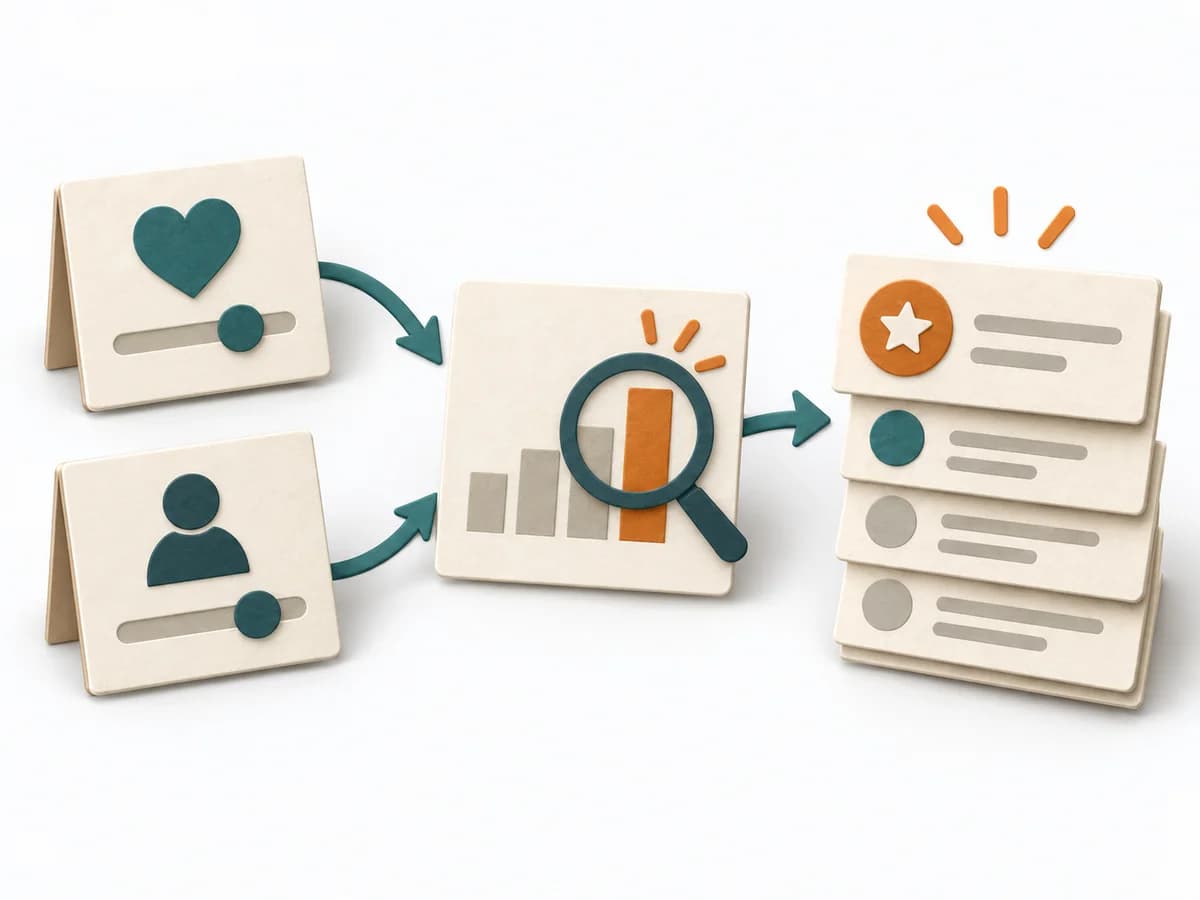
Moves customer problem, solution idea, and evidence toward a concrete result through "collect outcomes from discovery", "define an importance scale", and "calculate and sort the score".
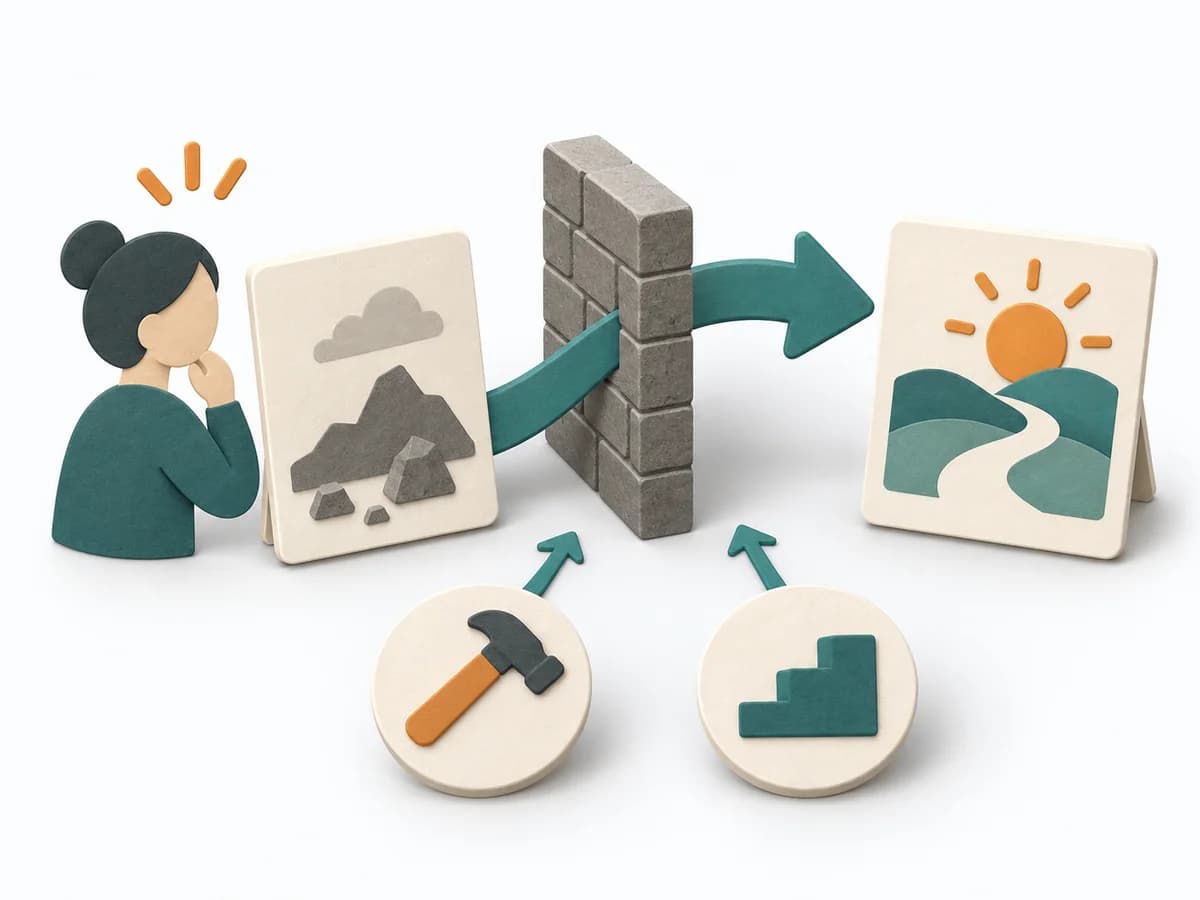
Reconstructs switching motives, progress, and desired outcomes so opportunities emerge from real customer situations.
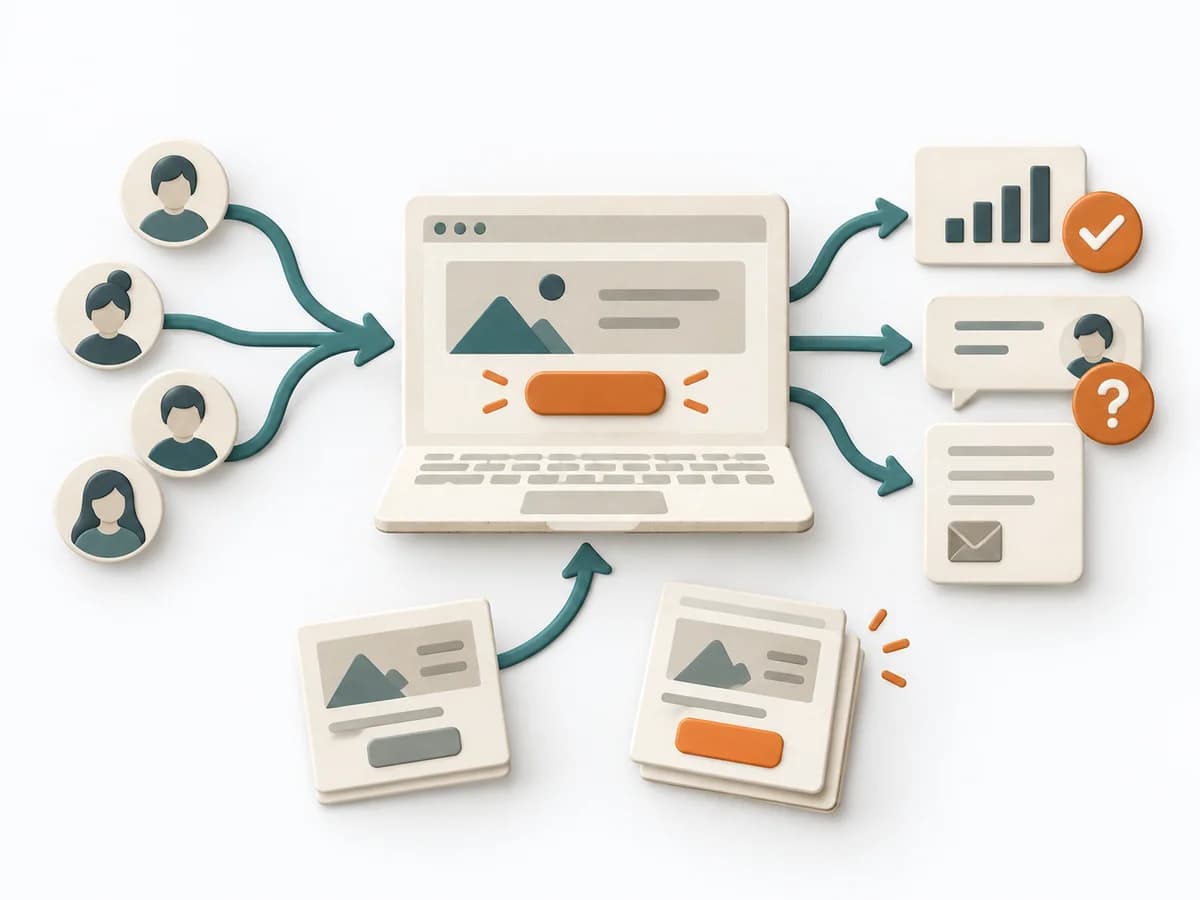
Tests value proposition and offering through a landing page, so conversion data supports early product decisions.
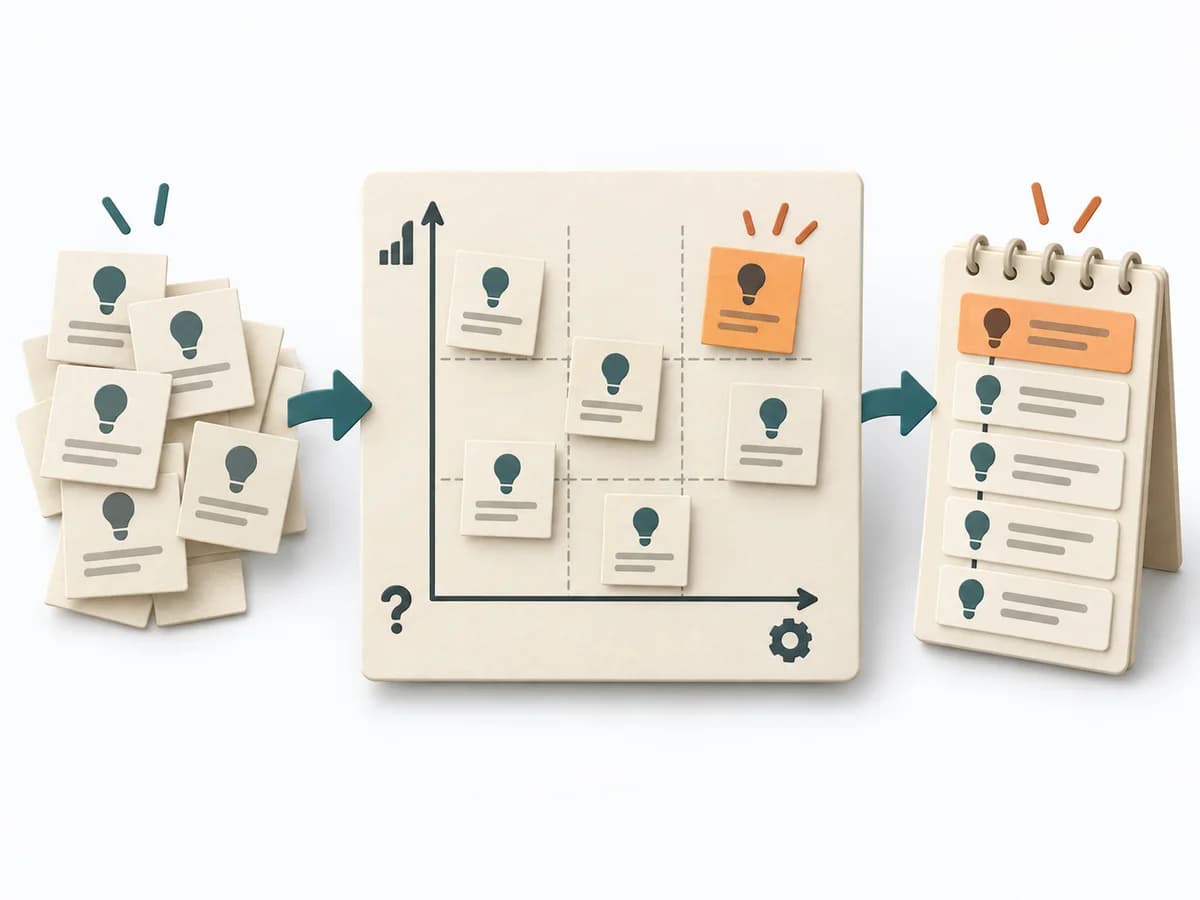
Moves customer problem, solution idea, and evidence toward a concrete result through "take over the hypothesis list", "define the risk scale", and "select the top hypotheses for the next tests".

Moves target group, value, goals, and priorities toward a concrete result through "prepare the idea backlog", "define scales for I, C, and E", and "select top ideas for testing or building".