Affinity Estimation: Worksheet
Set subject, data, roles, flow, and review.
# Affinity Estimation: Worksheet

## Question
To be confirmed

## Desired outcome
To be confirmed

## Scope
Practice run
Time: 30–60 minutes for 20–50 comparable items; analyse disputed items afterwards.

Complete this worksheet on paper or in your own document during the work.

## Preparation for this scope

### Method setup
- **Materials:** Comparable refined items, shared Definition of Done, relative scale, reference items, and discussion pile
- **Roles:** Delivery team sorts · product owner clarifies · facilitator protects silent flow
- **Advance information:** Set item set, included work, and shared Definition of Done; remove unclear or unlike items first.
- **Overall time needed:** 30–60 minutes for 20–50 comparable items; analyse disputed items afterwards.
- **Setup:** Prepare a workspace with Frame · Anchors · Sort · Conflicts · Calibrate; separate example from live data.

### Prepare for the work steps

#### Frame: Comparison set
- Set item set, included work, and shared Definition of Done; remove unclear or unlike items first.
- Comparable refined items, shared Definition of Done, relative scale, reference items, and discussion pile

#### Anchors: Size anchors
- Comparison set

#### Sort: First sort
- Size anchors

#### Conflicts: Clarification pile
- First sort

#### Calibrate: Relative estimate
- Clarification pile


## Affinity Estimation · working structure

| Item | Included | Reference | First placement | Conflict | Outcome | Follow-up |
| --- | --- | --- | --- | --- | --- | --- |
| Delete token |   |   |   |   |   |   |
| Save card |   |   |   |   |   |   |
| Provider migration |   |   |   |   |   |   |

- **Delete token:** Add evidence and rationale.
- **Save card:** Add evidence and rationale.
- **Provider migration:** Add evidence and rationale.

The blank worksheet contains prompts only.

[Reference · original teaching example](https://www.mountaingoatsoftware.com/agile/story-points/affinity-estimation)


## Frame: Comparison set
Expected artifact: Comparison set

Set comparable items and one shared meaning of size.

Entry:

...

- [ ] Do all items include the same work types and Done standard?

## Anchors: Size anchors
Expected artifact: Size anchors

Place a known small, medium, and large item as relative orientation.

Entry:

...

- [ ] Are anchors understood and from the same work domain?

## Sort: First sort
Expected artifact: First sort

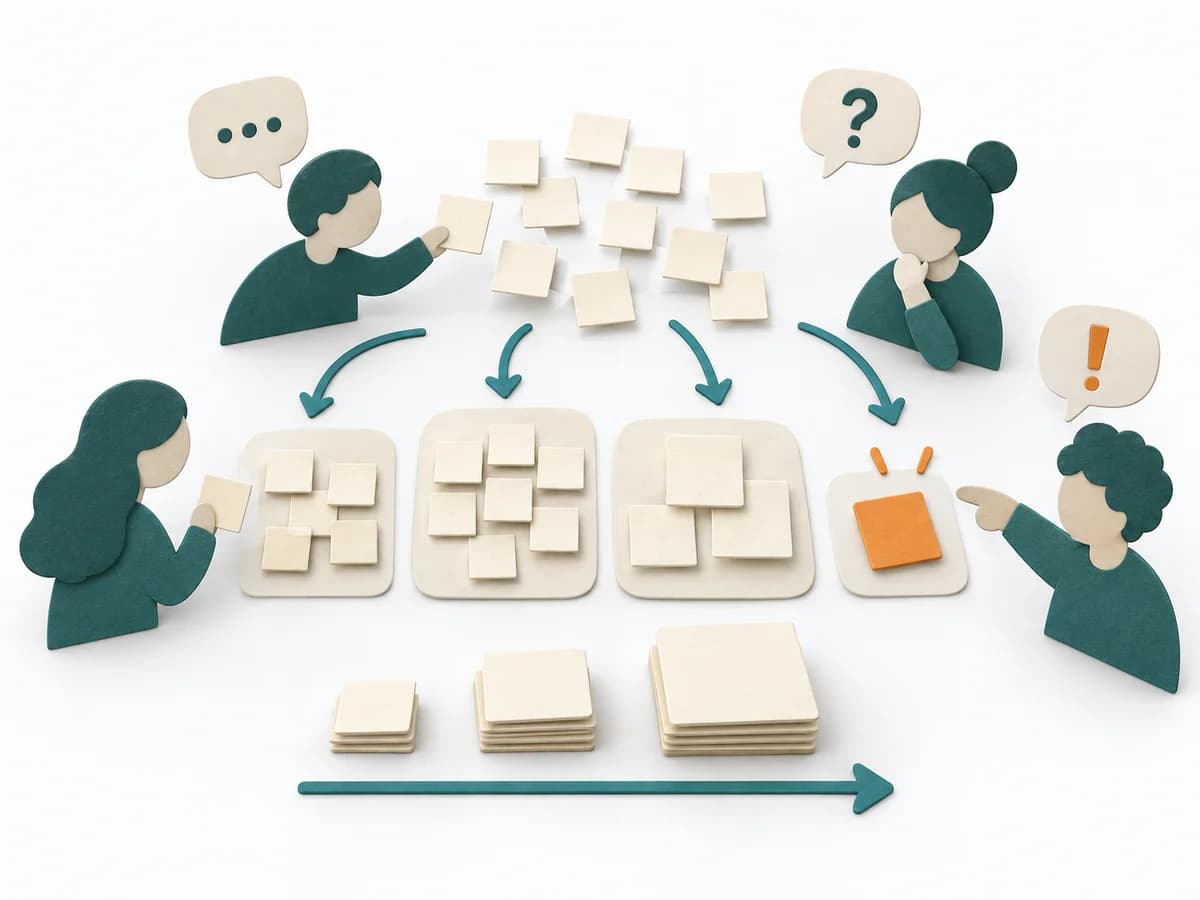
Team members silently place items relative to anchors; an item may be moved once.

Entry:

...

- [ ] Was placement independent before discussion or numeric anchoring?

## Conflicts: Clarification pile
Expected artifact: Clarification pile

On a second move request, put the item in discussion; resolve differences in scope and risk.

Entry:

...

- [ ] Does discussion expose different work models rather than preferences?

## Calibrate: Relative estimate
Expected artifact: Relative estimate

Name groups, inspect boundaries, and split or refer large and unclear items.

Entry:

...

- [ ] Are neighbourhoods plausible and open items assigned a next step?

## Open questions and next steps

...

Method guide: https://methodatlas.meierhoff-systems.de/en/methods/affinity-estimation/run-sheet
Monte Carlo Forecasting: Worksheet
Set subject, data, roles, flow, and review.
# Monte Carlo Forecasting: Worksheet

## Question
To be confirmed

## Desired outcome
To be confirmed

## Scope
Practice run
Time: 60–120 minutes for data check, simulation, and decision review; rerun regularly.

Complete this worksheet on paper or in your own document during the work.

## Preparation for this scope

### Method setup
- **Materials:** Remaining count or target date, consistent historical throughput sample, system/WIP context, many-run simulation, and quantile report
- **Roles:** Service owner · flow/data expert · delivery team · decision makers
- **Advance information:** Choose one question: when will N items finish or how many by date D; check service boundary, Done, data window, and comparability.
- **Overall time needed:** 60–120 minutes for data check, simulation, and decision review; rerun regularly.
- **Setup:** Prepare a workspace with Question · Sample · Simulate · Quantiles · Check · Decide; separate example from live data.

### Prepare for the work steps

#### Question: Forecast question
- Choose one question: when will N items finish or how many by date D; check service boundary, Done, data window, and comparability.
- Remaining count or target date, consistent historical throughput sample, system/WIP context, many-run simulation, and quantile report

#### Sample: Throughput data
- Forecast question

#### Simulate: Simulation runs
- Throughput data

#### Quantiles: Probabilities
- Simulation runs

#### Check: Robustness view
- Probabilities

#### Decide: Forecast decision
- Robustness view


## Monte Carlo Forecasting · working structure

| Forecast part | Input/logic | Fictional value | Check | Outcome | Decision | Reforecast |
| --- | --- | --- | --- | --- | --- | --- |
| Question |   |   |   |   |   |   |
| Sample |   |   |   |   |   |   |
| Simulation |   |   |   |   |   |   |
| Quantiles |   |   |   |   |   |   |

- **Question:** Add evidence and rationale.
- **Sample:** Add evidence and rationale.
- **Simulation:** Add evidence and rationale.
- **Quantiles:** Add evidence and rationale.

The blank worksheet contains prompts only.

[Reference · original teaching example](https://www.prokanban.org/forecasting-pocket-guide)


## Question: Forecast question
Expected artifact: Forecast question

Set forecast type, remaining count/time window, start, and required risk level.

Entry:

...

- [ ] Is exactly one quantity or date question expressed in count units?

## Sample: Throughput data
Expected artifact: Throughput data

Check historical throughput from the same system and cadence; retain zeros and normal variation.

Entry:

...

- [ ] Are period, team, WIP policy, and Done comparable enough?

## Simulate: Simulation runs
Expected artifact: Simulation runs

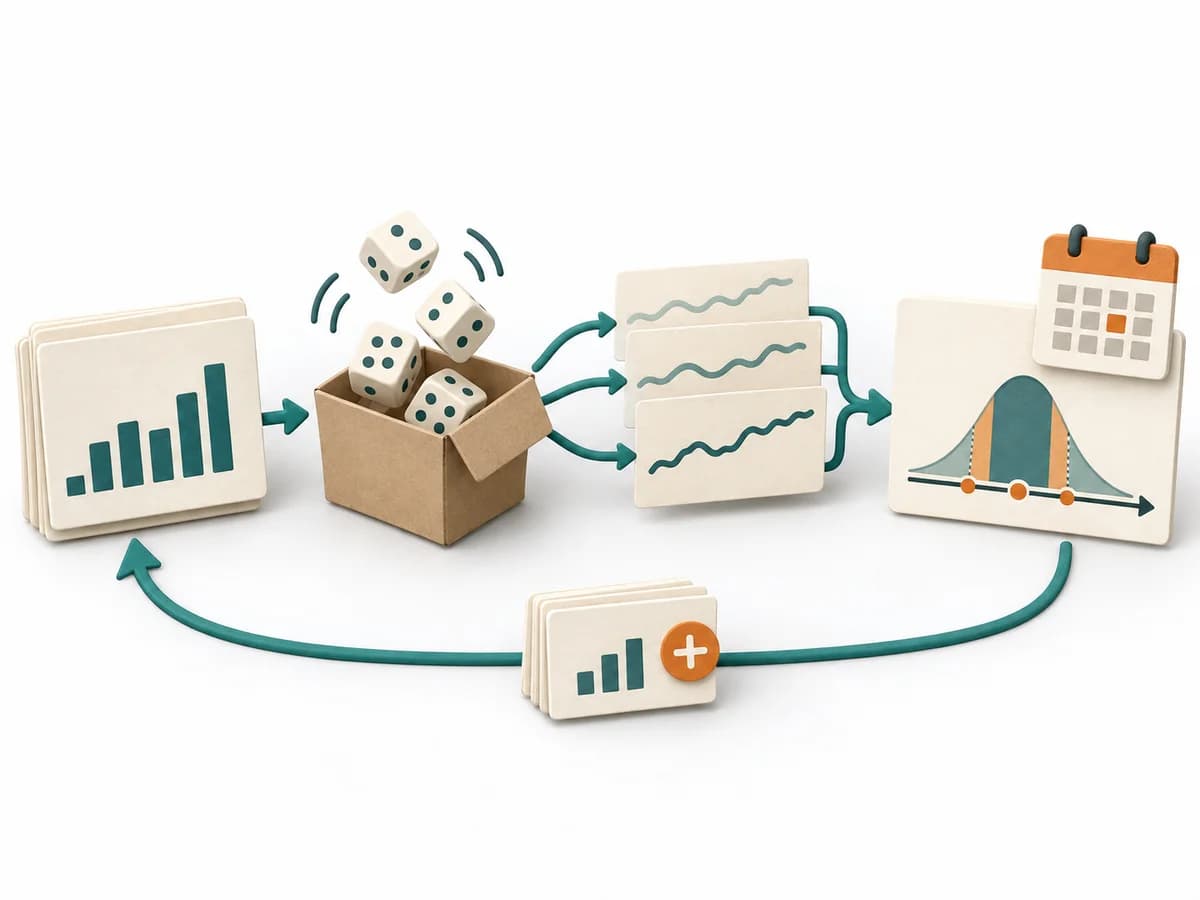
Each run samples weekly values with replacement, accumulates until remaining count is reached, and stores duration.

Entry:

...

- [ ] Does each draw correspond to one observed throughput period?

## Quantiles: Probabilities
Expected artifact: Probabilities

Sort durations and report several quantiles as risk levels.

Entry:

...

- [ ] Are P50/P85/P95 explained as by-with-likelihood rather than guarantees?

## Check: Robustness view
Expected artifact: Robustness view

Test sensitivity to data window, scope, and WIP change; backtest prior forecasts where possible.

Entry:

...

- [ ] Does the decision survive plausible data windows?

## Decide: Forecast decision
Expected artifact: Forecast decision

Choose accepted risk, record assumptions, and reforecast after scope/system change.

Entry:

...

- [ ] Is a concrete action tied to the quantile?

## Open questions and next steps

...

Method guide: https://methodatlas.meierhoff-systems.de/en/methods/monte-carlo-forecasting/run-sheet