View methods side by side.
Choose up to four methods. Add them using the search and share the comparison by copying its link.
| Criterion |  Facilitation Timeline | 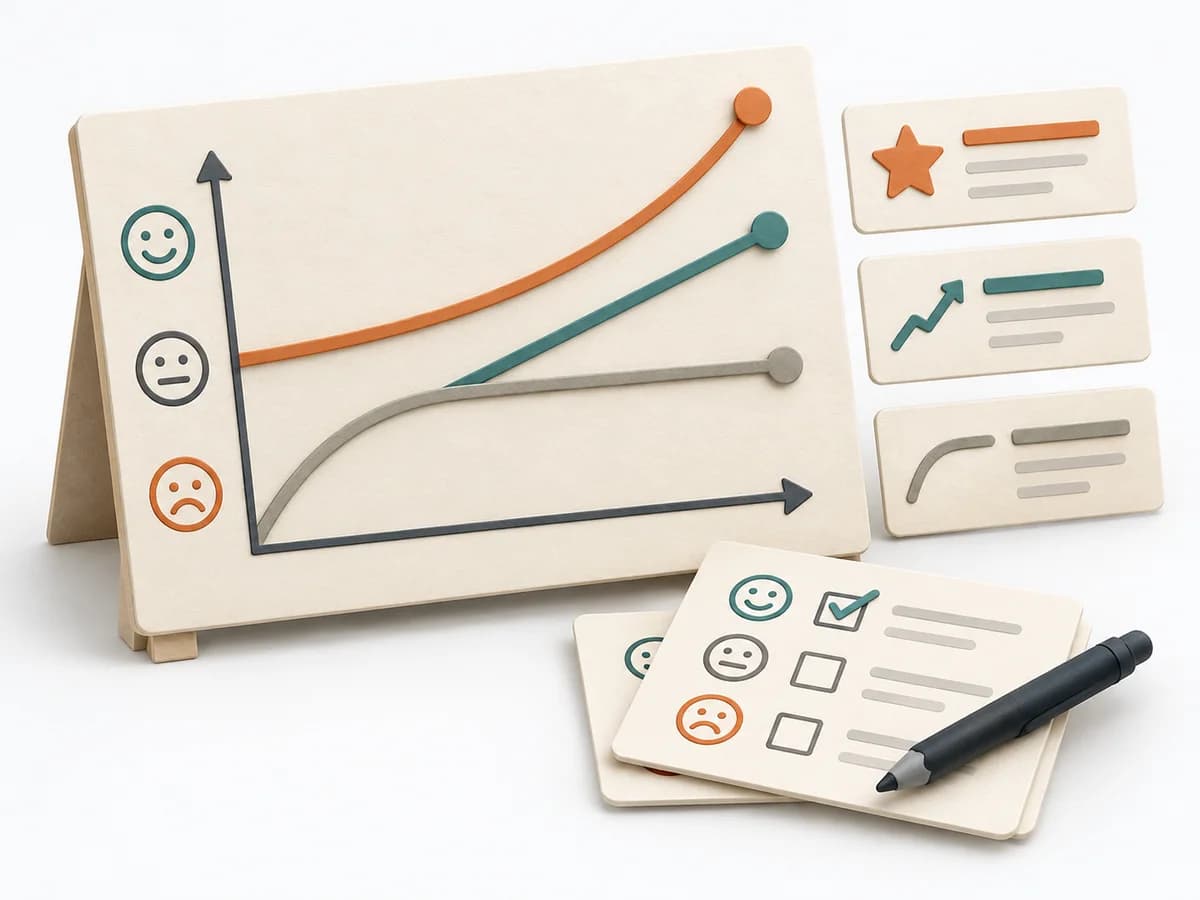 Product Discovery Kano Model |  UX Design Service Blueprinting |
|---|---|---|---|
Purposedifferent | When a project, incident, or change process is only remembered in fragments, Timeline brings the sequence back into a readable form. It makes turning points, precursors, and after-effects recognizable over the course of time. | When features need to be distinguished by their effect on satisfaction, it makes expectations and surprises comparable. It separates basic needs, performance contribution, and delight. | When a service experience is spread across several touchpoints, it brings frontstage and backstage together. It shows where user contact and internal responsibility must fit. |
Complexitydifferent | Low | Medium | High |
Timedifferent | 30-90 min | 1-2 Tage | 0.5-2 Tage |
Participantsdifferent | 2-12 | 10-50 | 6-12 |
Formatdifferent | Workshop + async | Workshop + async | Workshop |
Outputdifferent | Timeline, Milestones, Insight Notes | Kano Matrix, Feature Classes, Priority Themes | Service Blueprint, Fail Points, Ownership Map |
Tagsno overlap | TimelineFacilitationSequence | SatisfactionPrioritizationCustomer | Service designOperationsJourneyBlueprint |
Often compared together
Methods with strong topical overlap with the current selection, not yet in the comparison.