View methods side by side.
Choose up to four methods. Add them using the search and share the comparison by copying its link.
| Criterion | 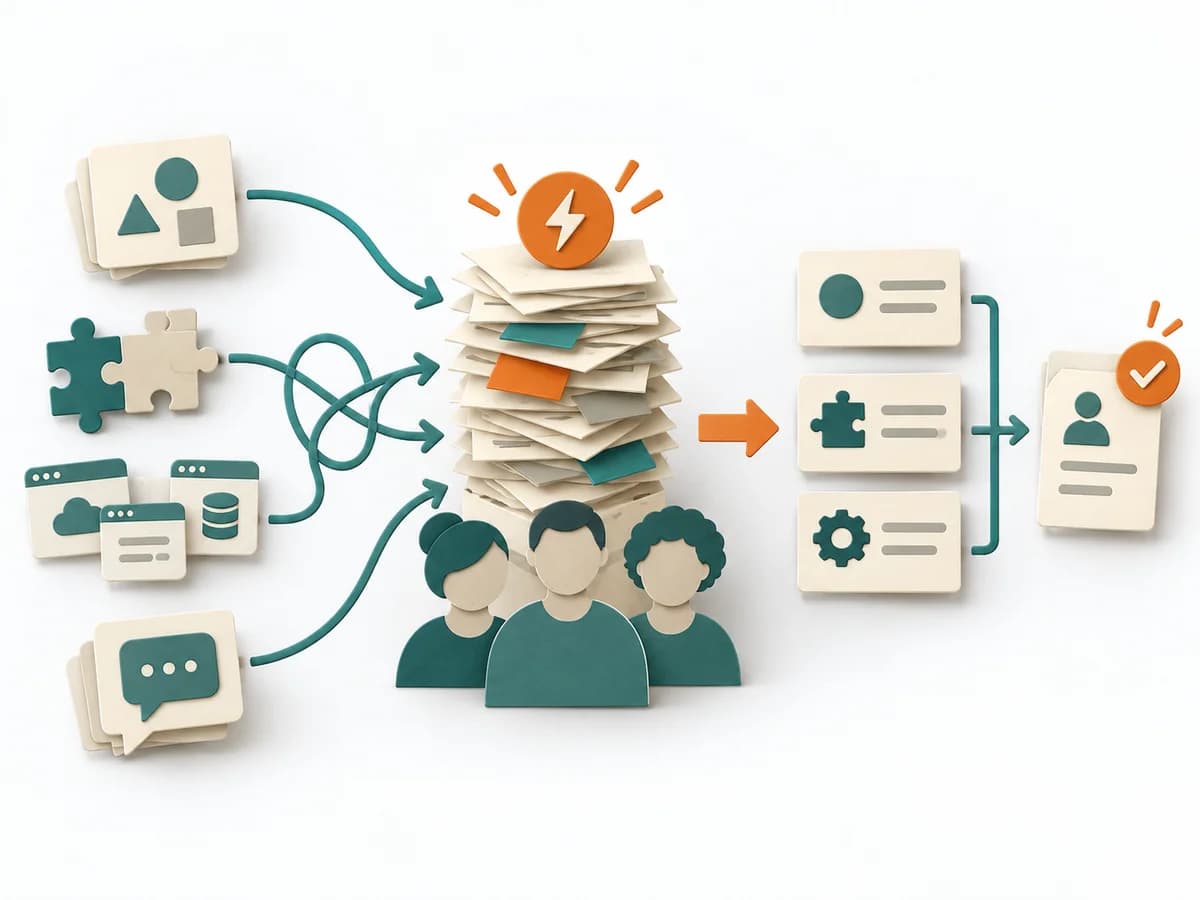 Team Design Team Cognitive Load Assessment |  Operations Process Mapping |  Operations 5 Whys |
|---|---|---|---|
Purposedifferent | When a team juggles too many domains, systems, or handoffs, it measures mental overload as an organizational problem. It clarifies responsibility, interaction, and load between teams. The result is captured as a cognitive-load profile and action list. | With a confusing workflow that has many handoffs, the method makes the actual process visible. It shows where work is passed on, delayed, or duplicated, so improvement targets the right spots. | For a single, hard-to-explain deviation, the method exposes the causal chain behind the visible symptom. It keeps the cause open until a controllable condition emerges instead of a mere description. |
Complexitydifferent | Medium | Medium | Low |
Timedifferent | 60-90 min | 1-3 h | 15-30 min |
Participantsdifferent | 3-12 | 3-10 | 2-6 |
Formatdifferent | Workshop + async | Workshop | Workshop |
Outputdifferent | Cognitive Load Profile, Action List | Process Map, Handoff List, Improvement Backlog | Root cause notes, Countermeasures |
Tagsno overlap | TeamComplexityImprovementDiagnosis | ProcessOperationsImprovement | Root causeIncidentLeanProblem solving |
Often compared together
Methods with strong topical overlap with the current selection, not yet in the comparison.