View methods side by side.
Choose up to four methods. Add them using the search and share the comparison by copying its link.
| Criterion | 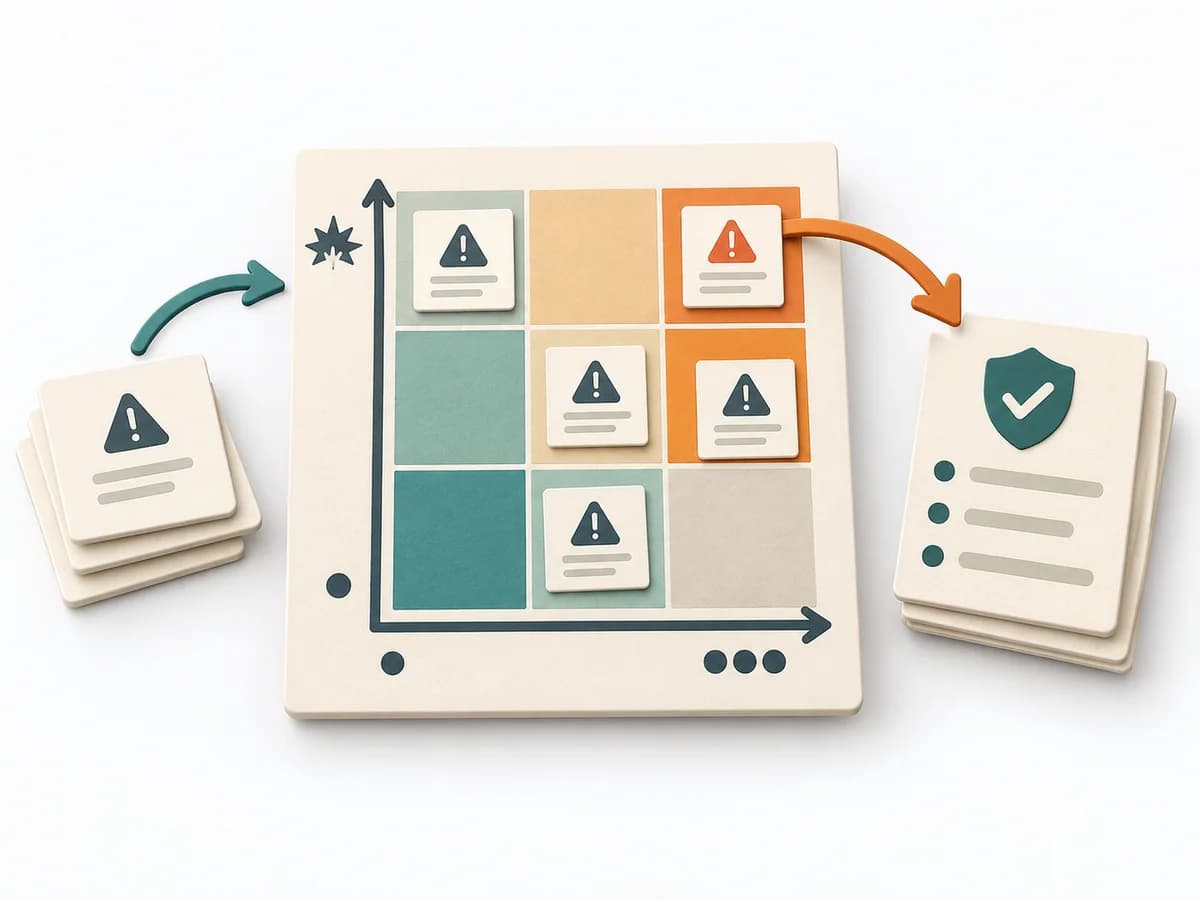 Decision Making Risk Matrix | 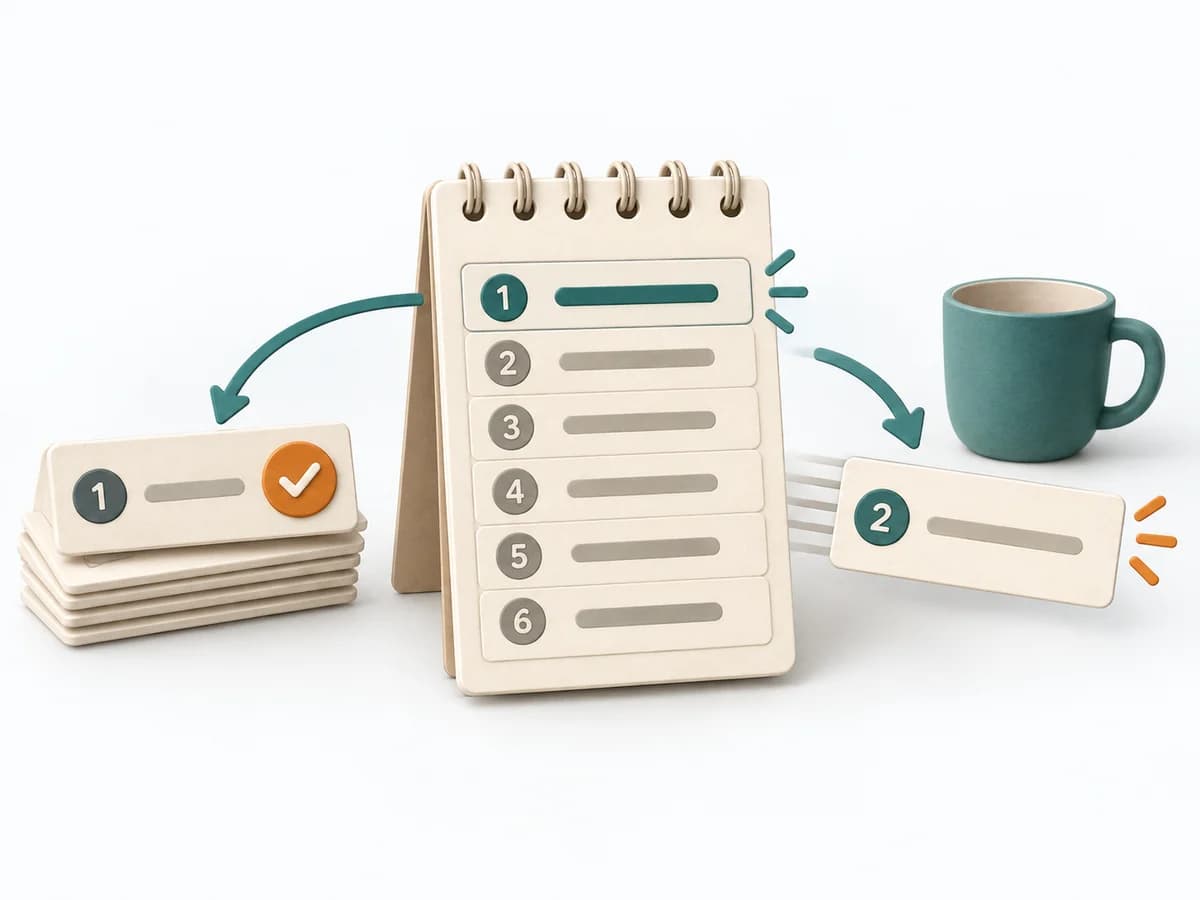 Operations Ivy Lee Method | 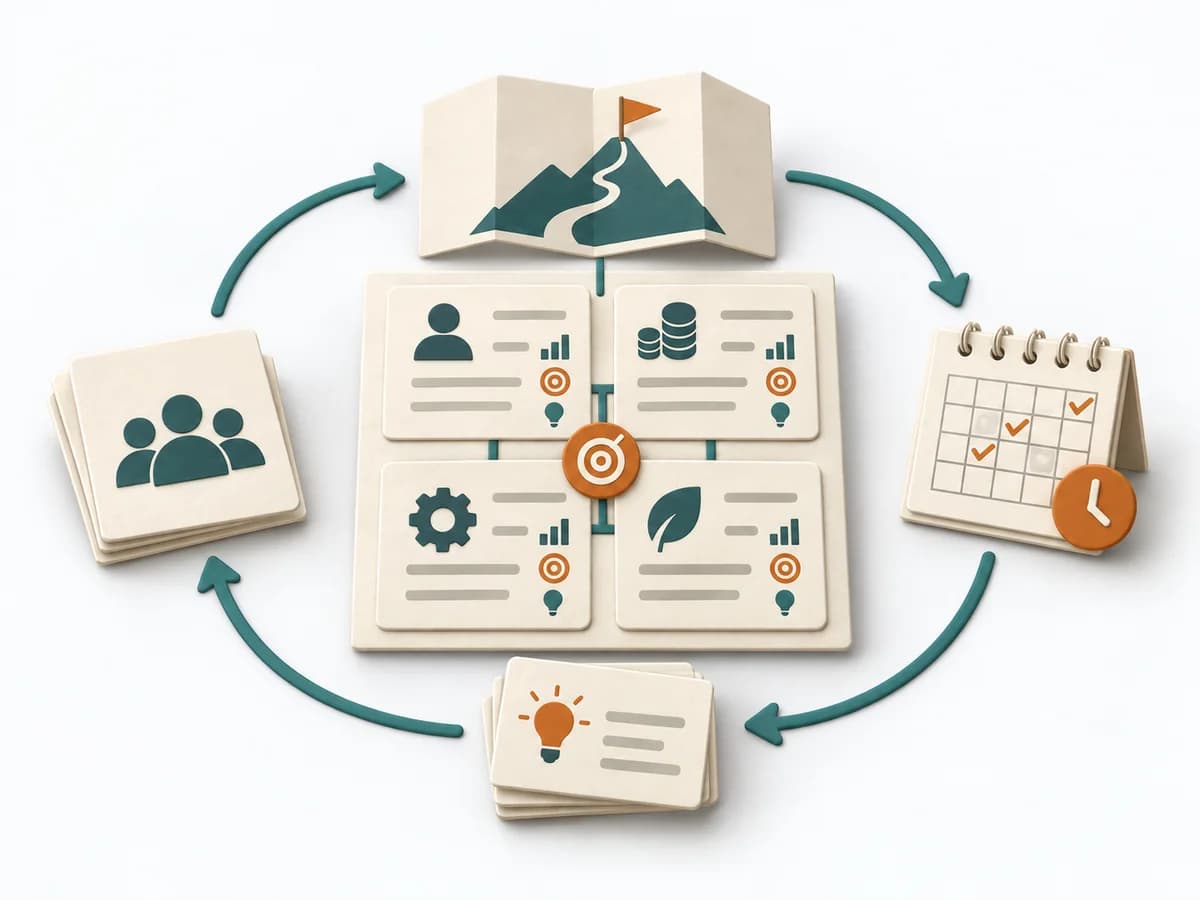 Business Strategy Balanced Scorecard |
|---|---|---|---|
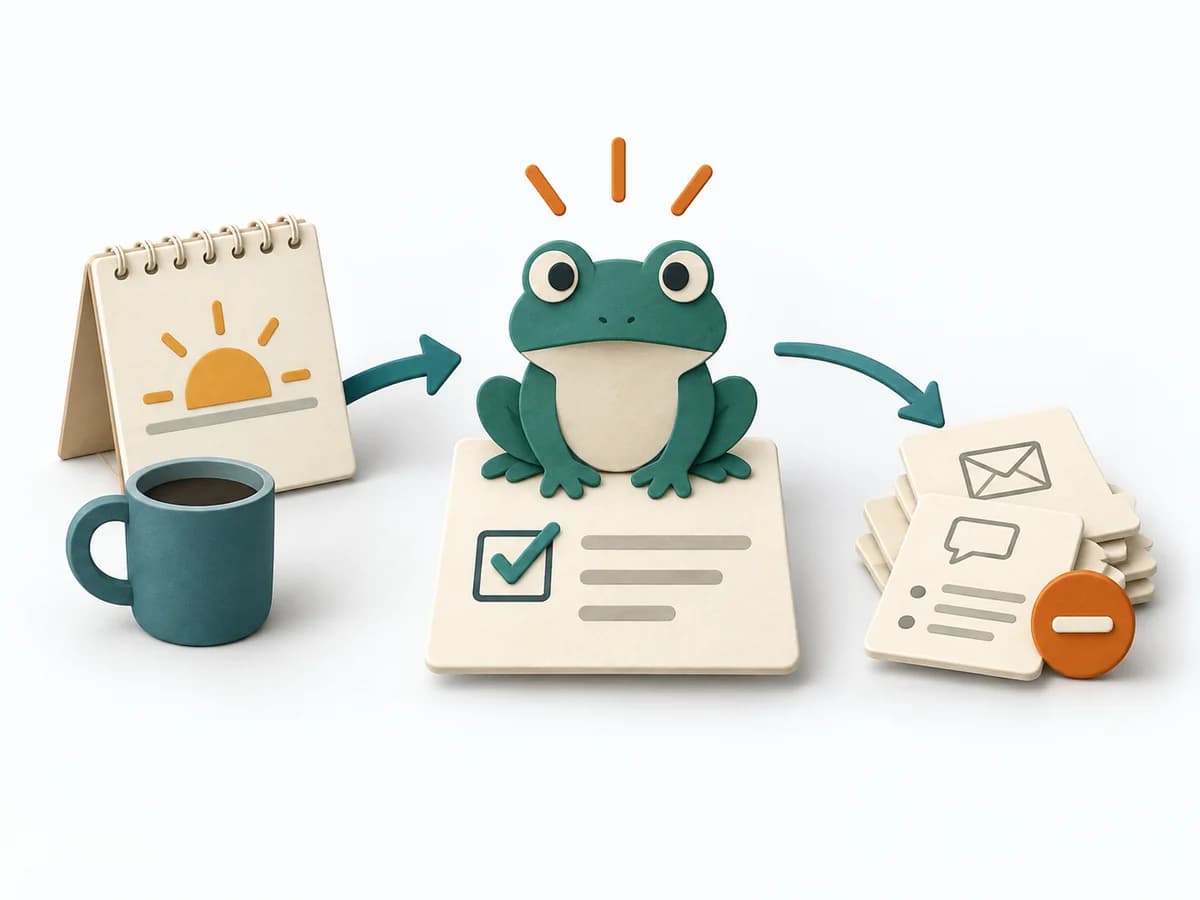
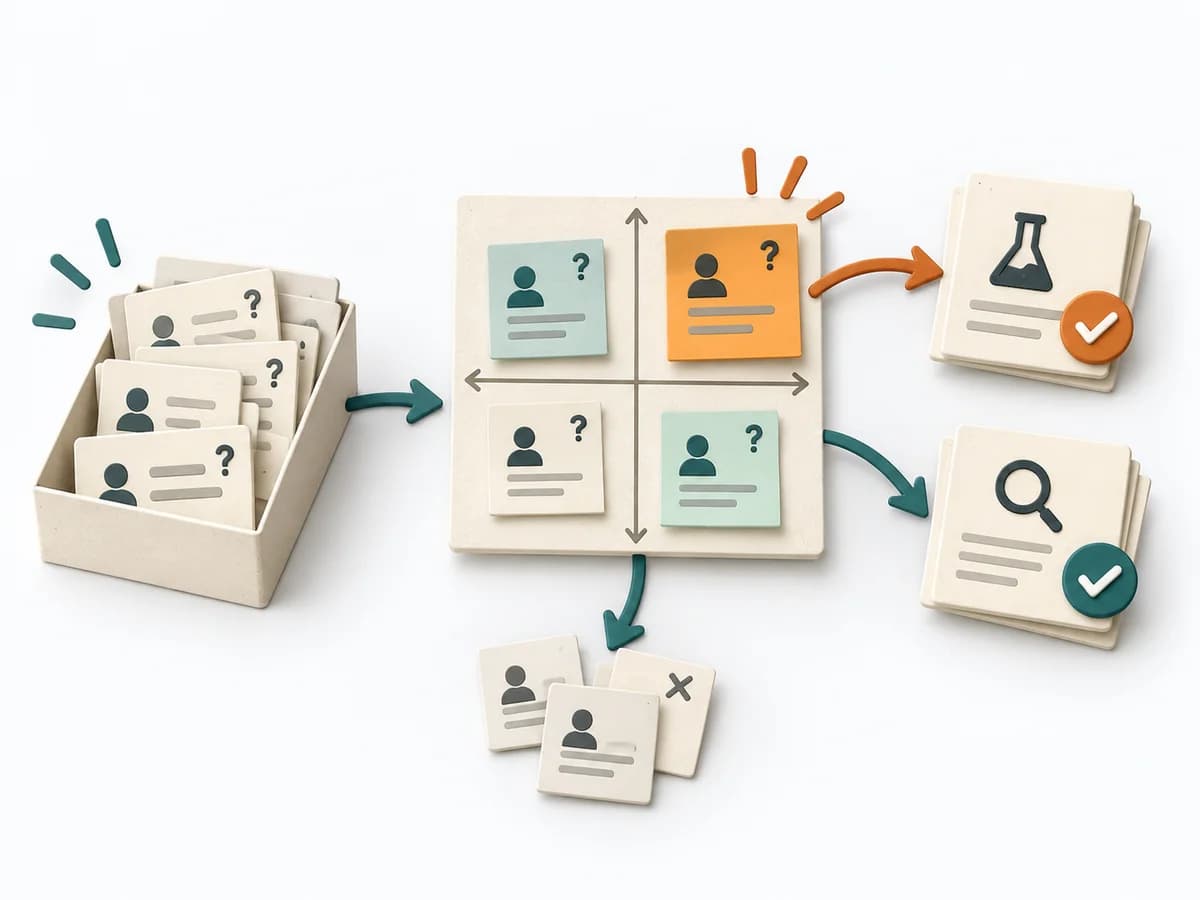
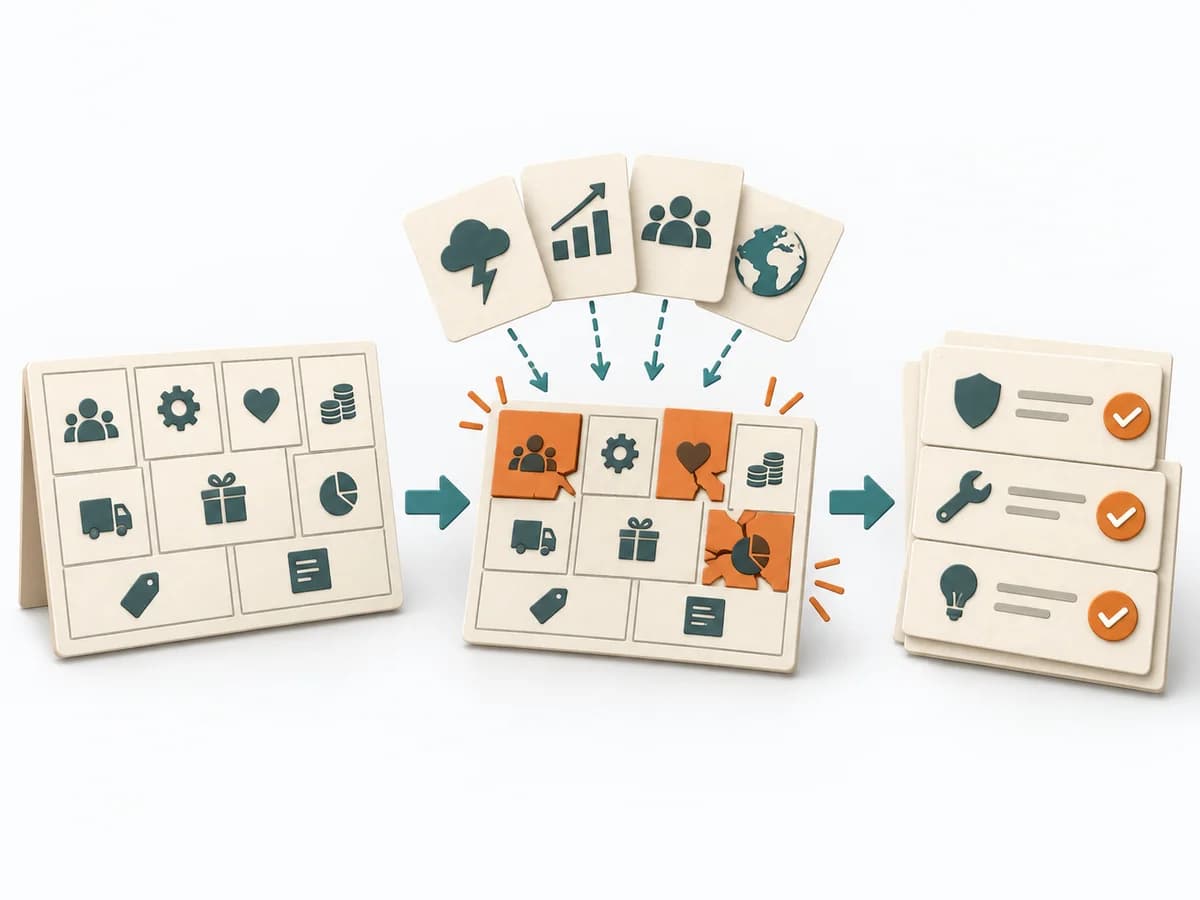
Purposedifferent | When a project faces many possible disruptions, it quickly becomes unclear which risks deserve attention first. It separates options, evaluation criteria, and open risks. The result is captured as a Risk Matrix and a Top Risk List. | With a restless workday full of too many open items, the method creates radical simplicity. It directs attention to a short sequence instead of a broad, still-open field. | Balanced Scorecard translates strategy into a few interconnected perspectives and metrics. It holds impact, steering, and learning together in daily work instead of narrowing strategy down to financial figures. |
Complexitydifferent | Low | Low | High |
Timedifferent | 30-60 min | 5-10 min daily | Halber Tag bis mehrere Wochen |
Participantsdifferent | 3-10 | 1 | 4-12 |
Formatdifferent | Workshop + async | Async | Workshop + async |
Outputdifferent | Risk Matrix, Top Risk List | Daily Priority List, Completion Notes | Balanced Scorecard, Strategic Measures, Initiative Map |
Tagsno overlap | RiskDecisionPrioritizationAssessment | PrioritizationProductivityExecution | StrategyMetricsExecution |
Often compared together
Methods with strong topical overlap with the current selection, not yet in the comparison.