View methods side by side.
Choose up to four methods. Add them using the search and share the comparison by copying its link.
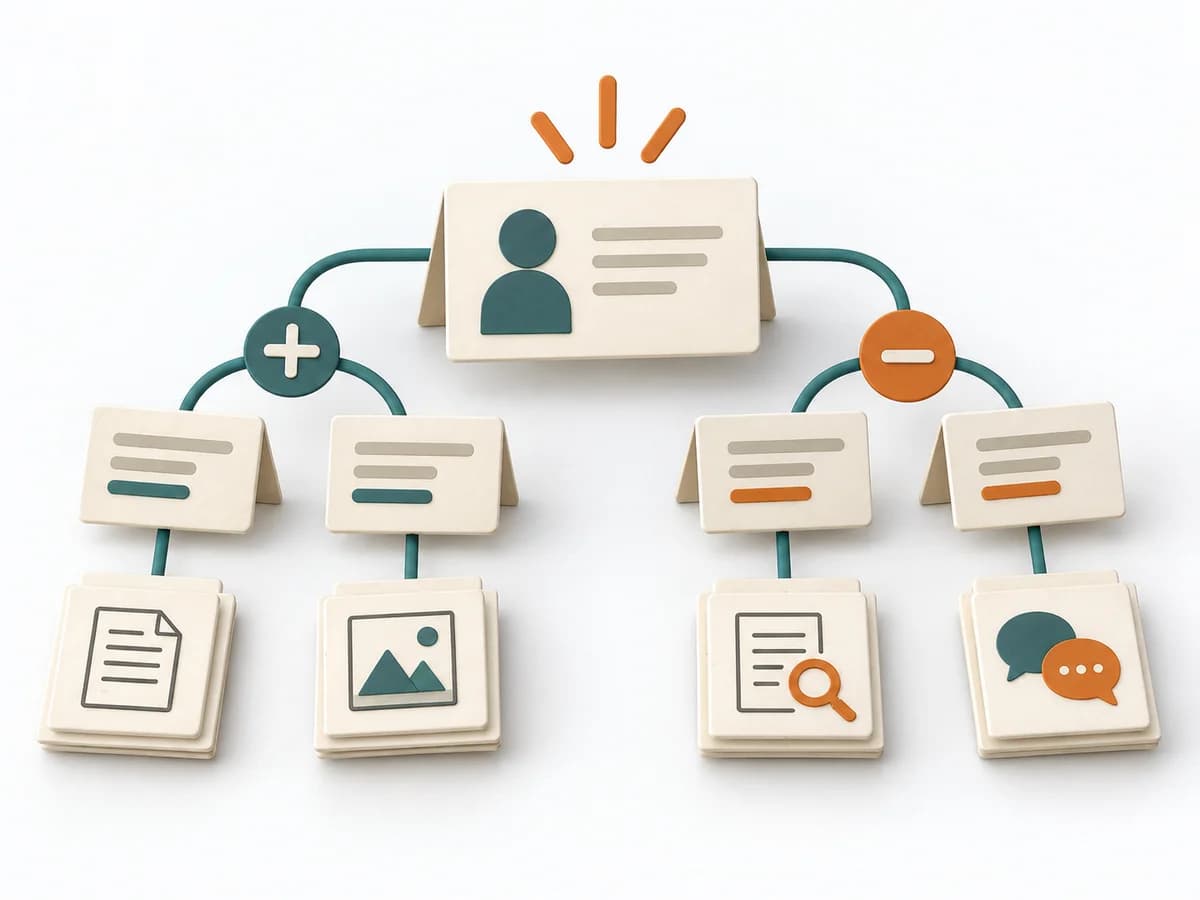
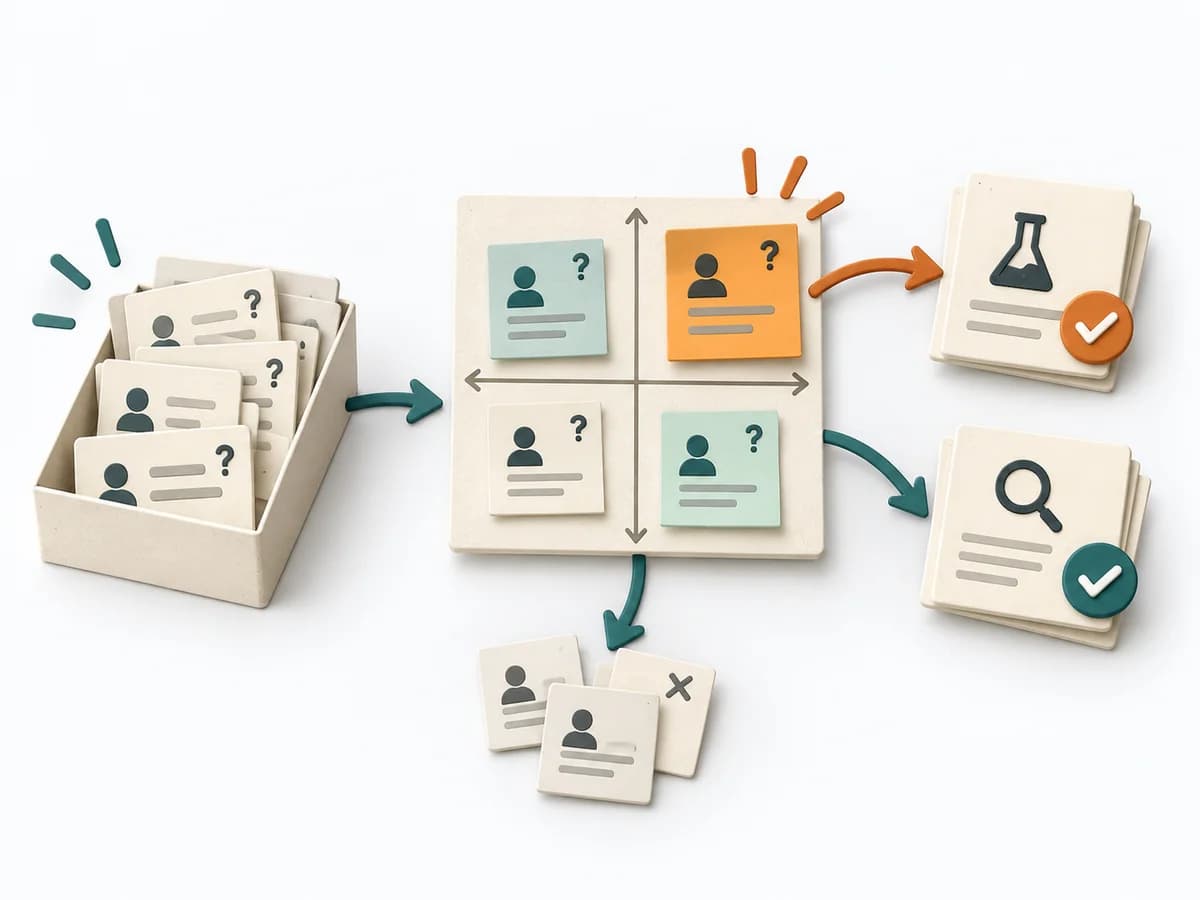
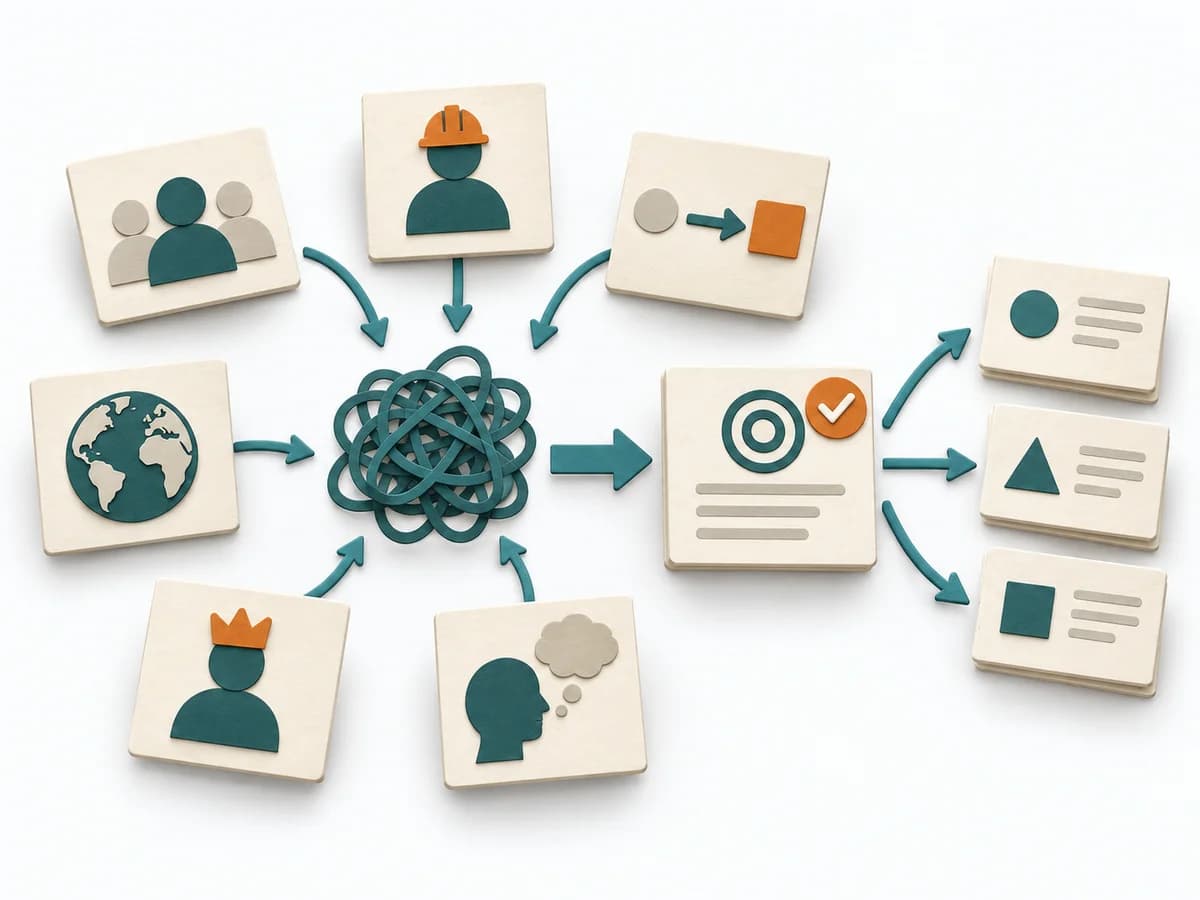
| Criterion | 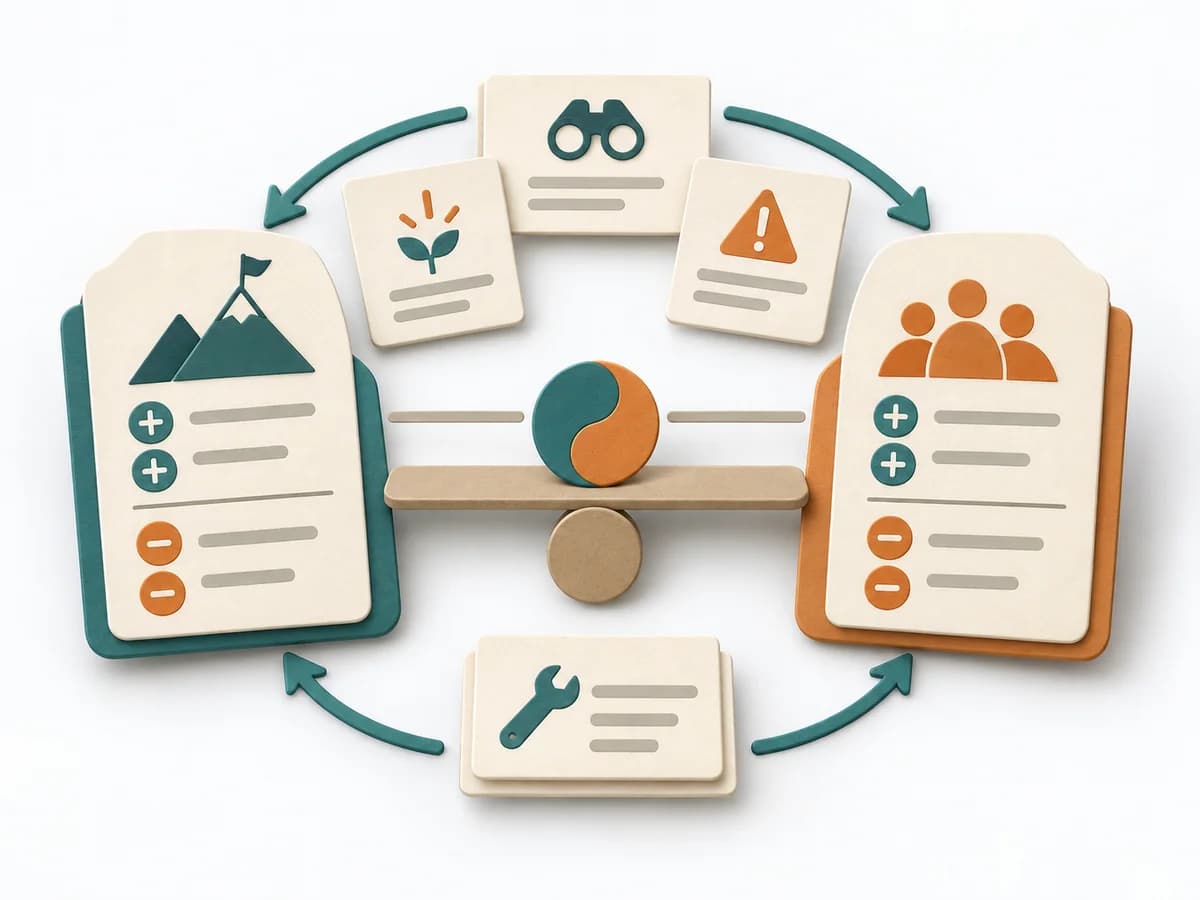 Systems Thinking Polarity Mapping | 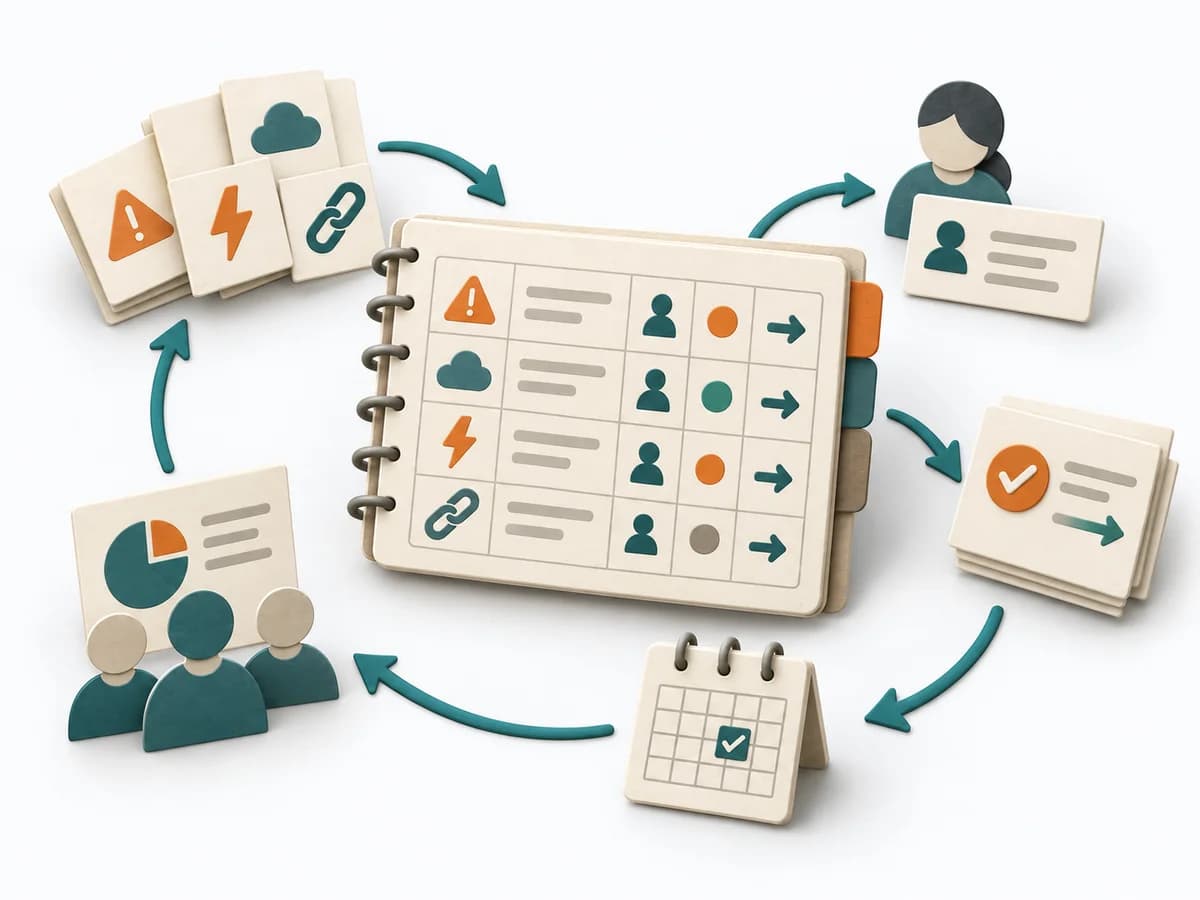 Delivery RAID Log | 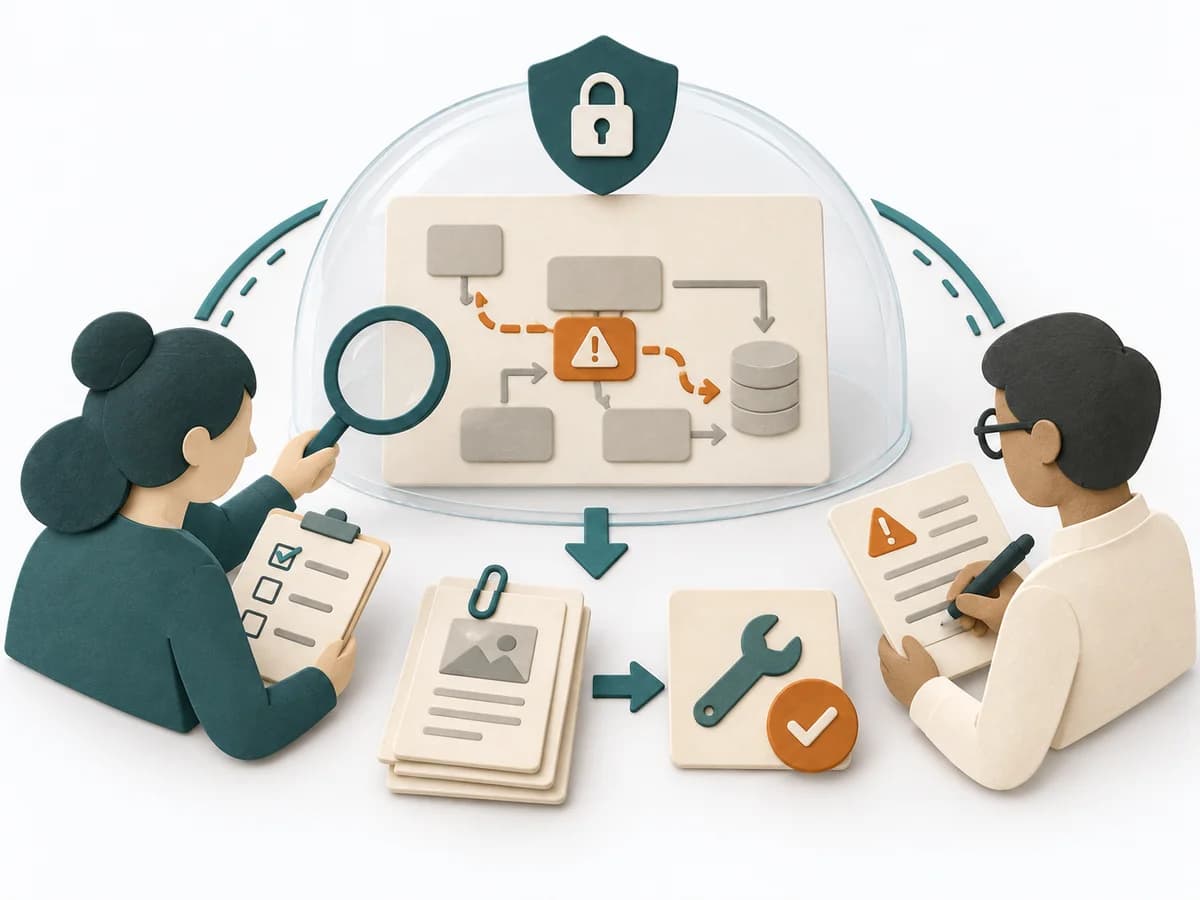 Decision Making Red Teaming |
|---|---|---|---|
Purposedifferent | Polarity Mapping makes tensions between two opposing poles tangible, such as standardization and adaptation or control and autonomy. The method guards against making apparent either-or decisions prematurely. | Helps clarify scope, sequence, and delivery flow in concrete terms. It makes work, boundaries, and order steerable. The result is captured as a RAID Log and a source for status reporting. | For strategic decisions with high reach, agreement and gut feeling are often not enough. Red teaming brings deliberate opposition into the situation and tests where a plan breaks under real counterarguments. |
Complexitydifferent | Medium | Low | High |
Timedifferent | 1-2 h | 30 min Setup, dann laufend | 1-4 h |
Participantsdifferent | 3-12 | 1-3 maintaining, briefing for everyone | 3-8 |
Formatdifferent | Workshop | Async | Workshop |
Outputdifferent | Polarity Map, Warning Signs, Balance Actions | RAID Log, Status Report Source | Challenge Findings, Risk Register, Mitigation Plan |
Tagsno overlap | Systems thinkingTradeoffsLeadership | RiskTrackingStakeholdersGovernance | RiskDecisionSensemaking |
Often compared together
Methods with strong topical overlap with the current selection, not yet in the comparison.