View methods side by side.
Choose up to four methods. Add them using the search and share the comparison by copying its link.
| Criterion | 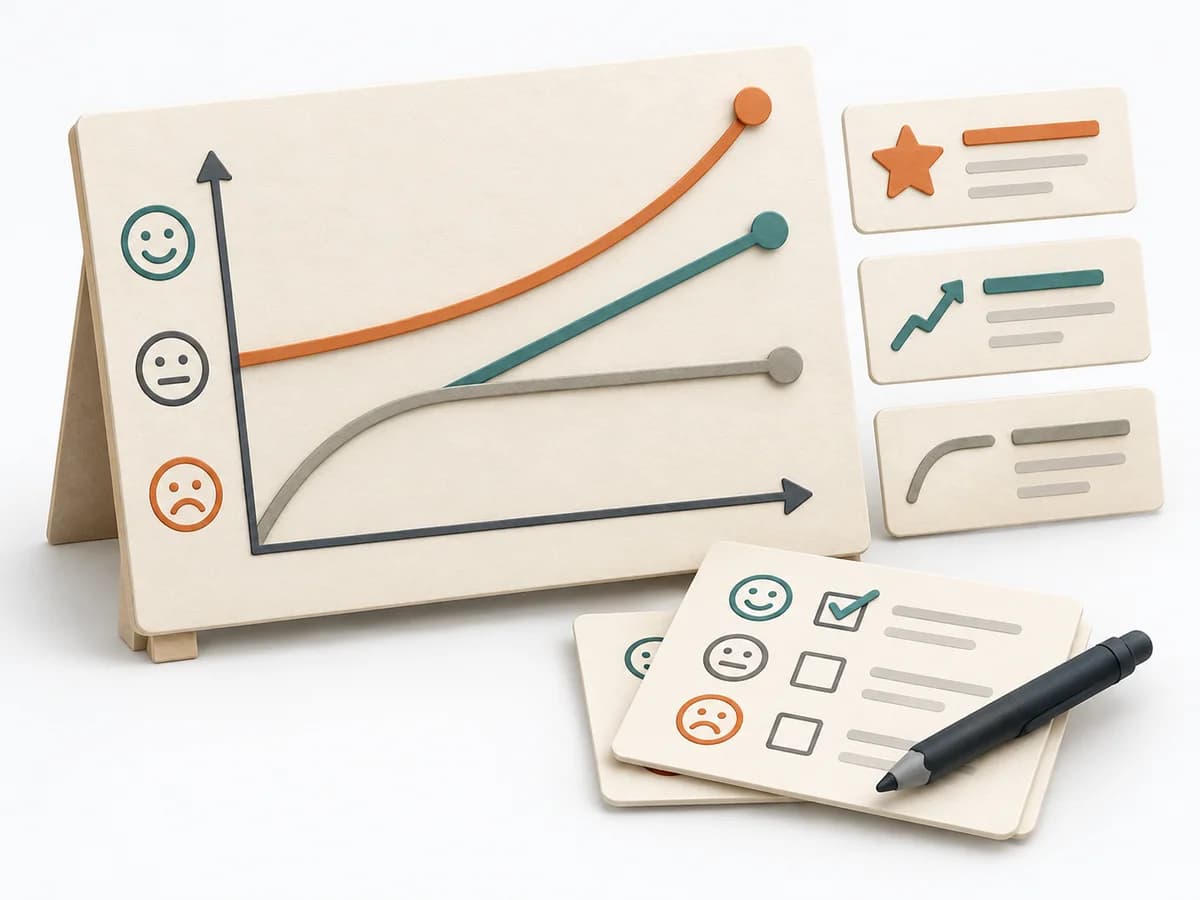 Product Discovery Kano Model | 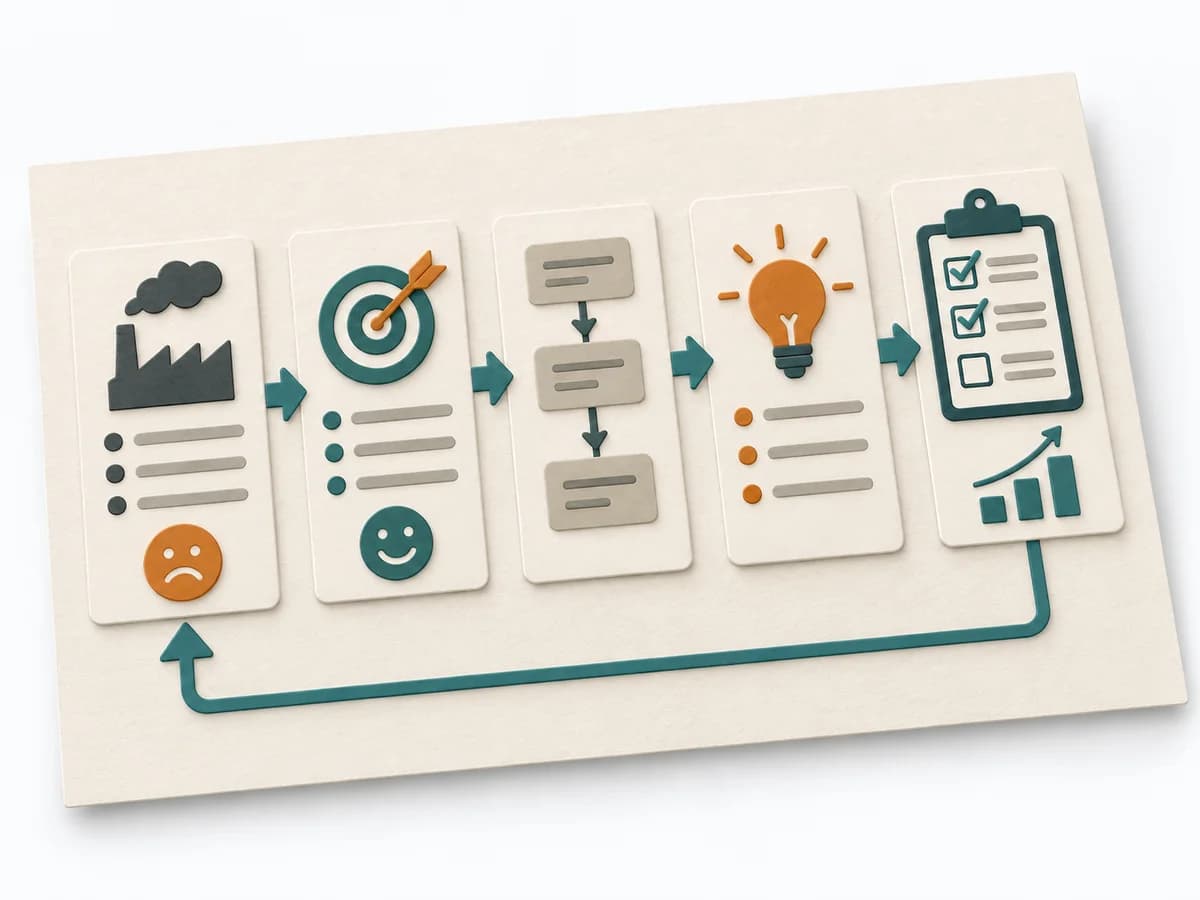 Operations A3 Problem Solving | 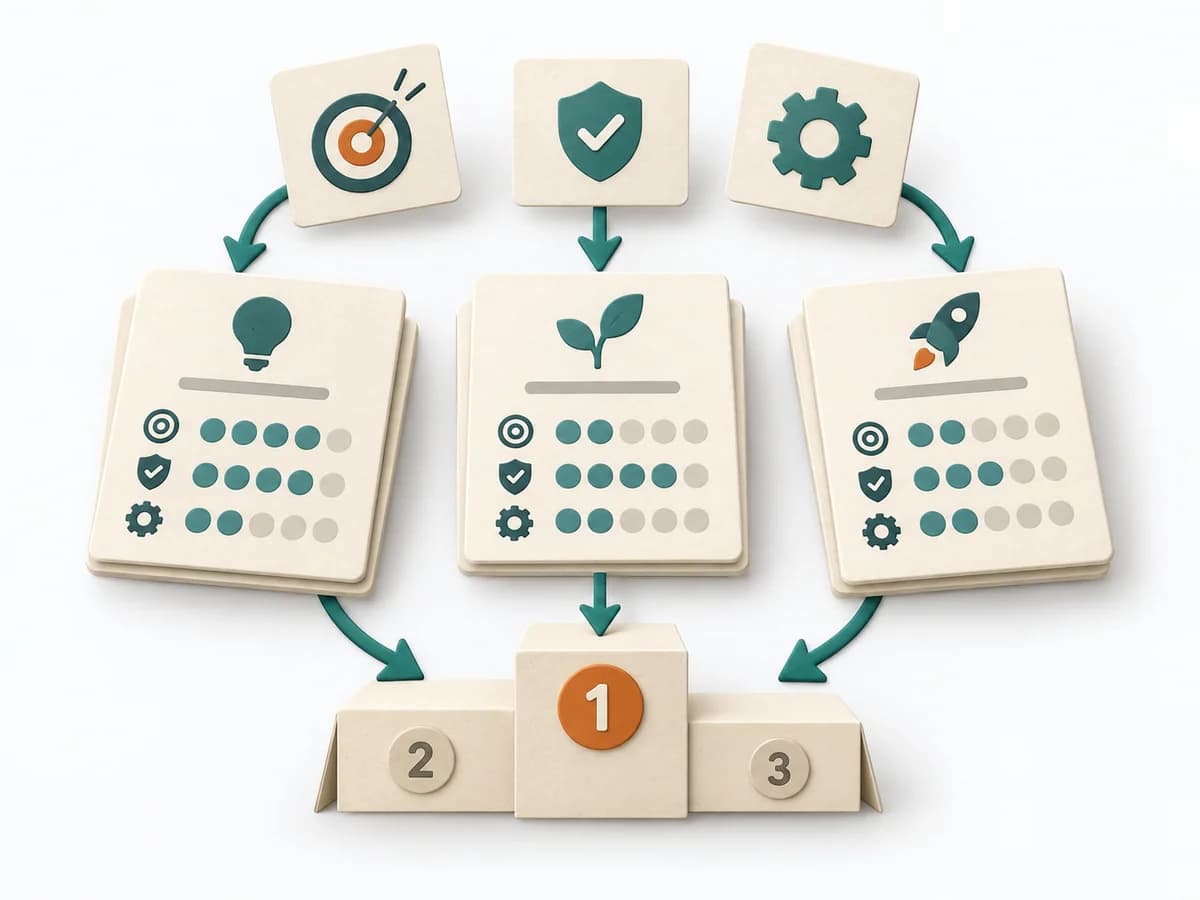 Product Strategy ICE Scoring |
|---|---|---|---|
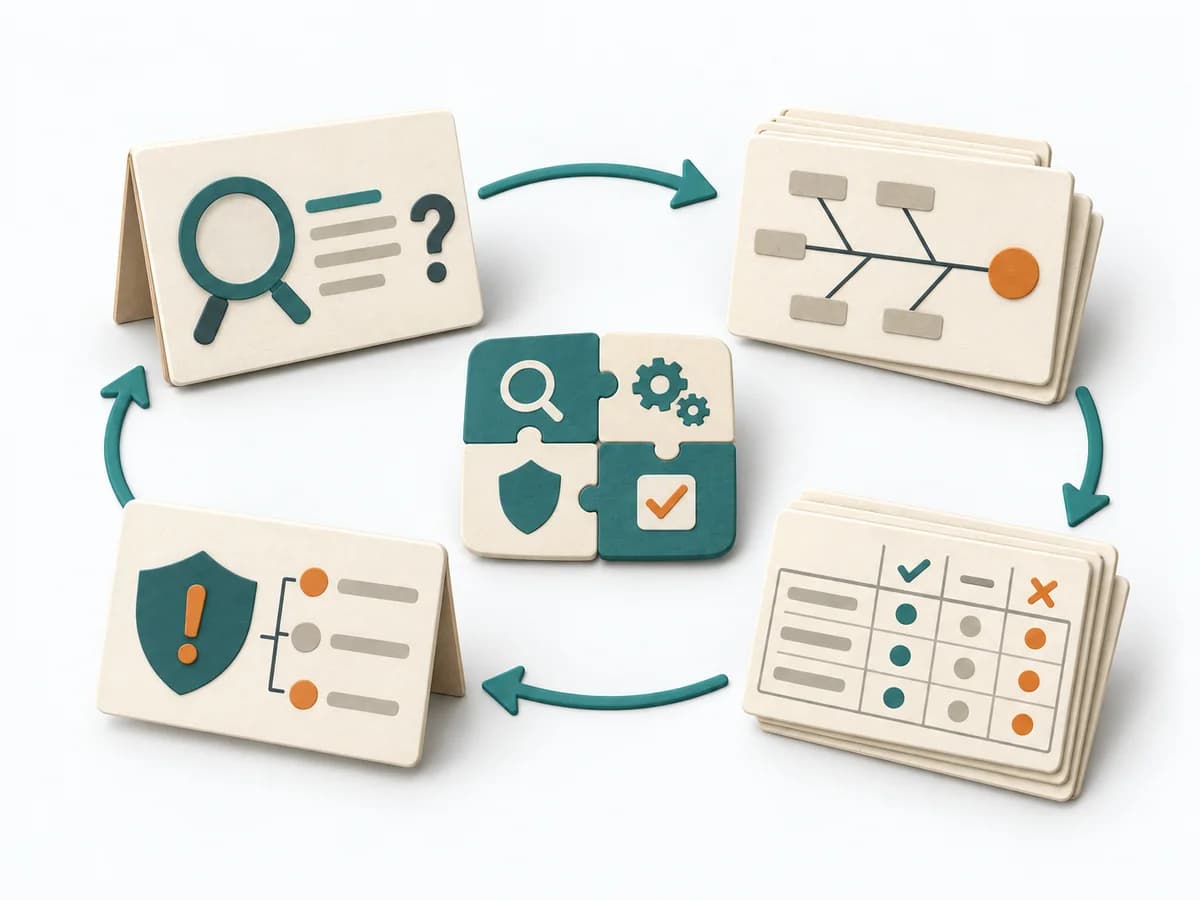
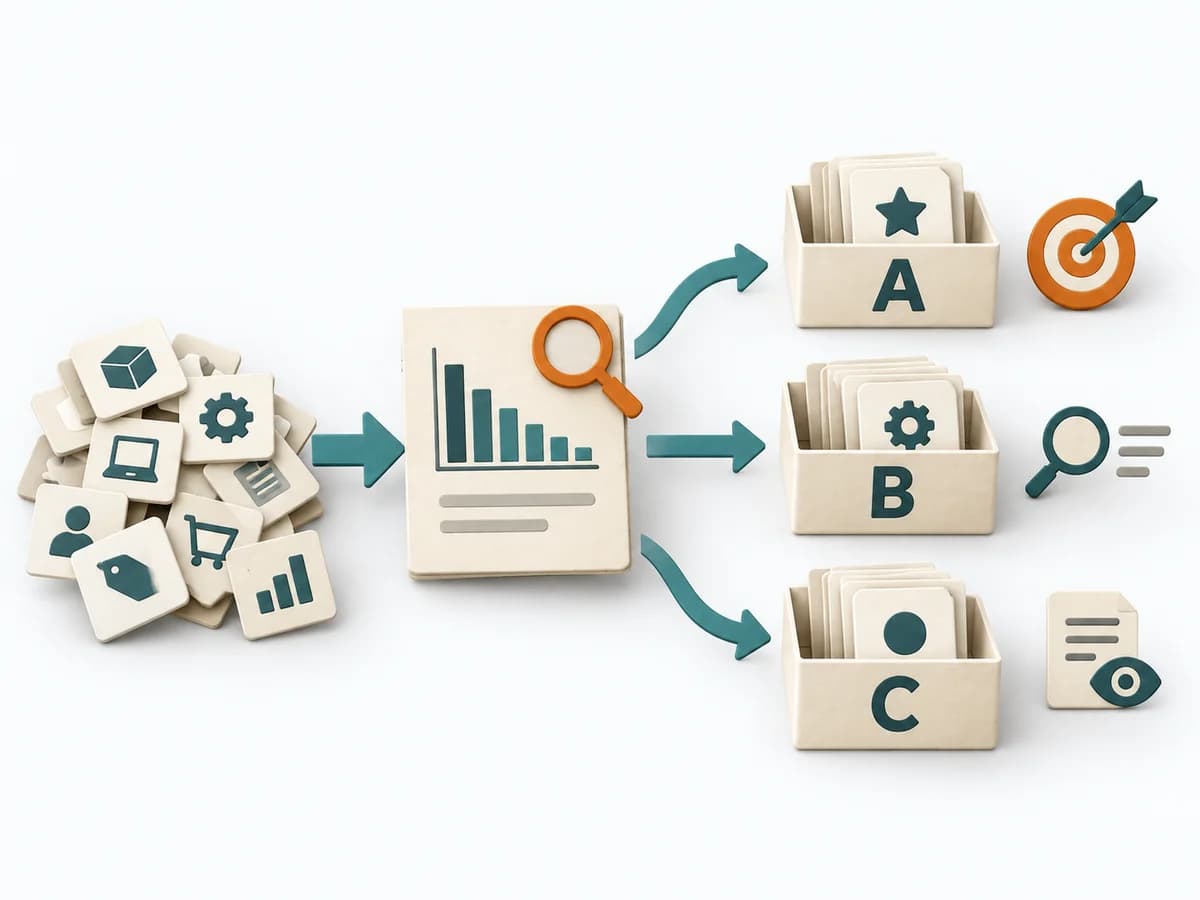
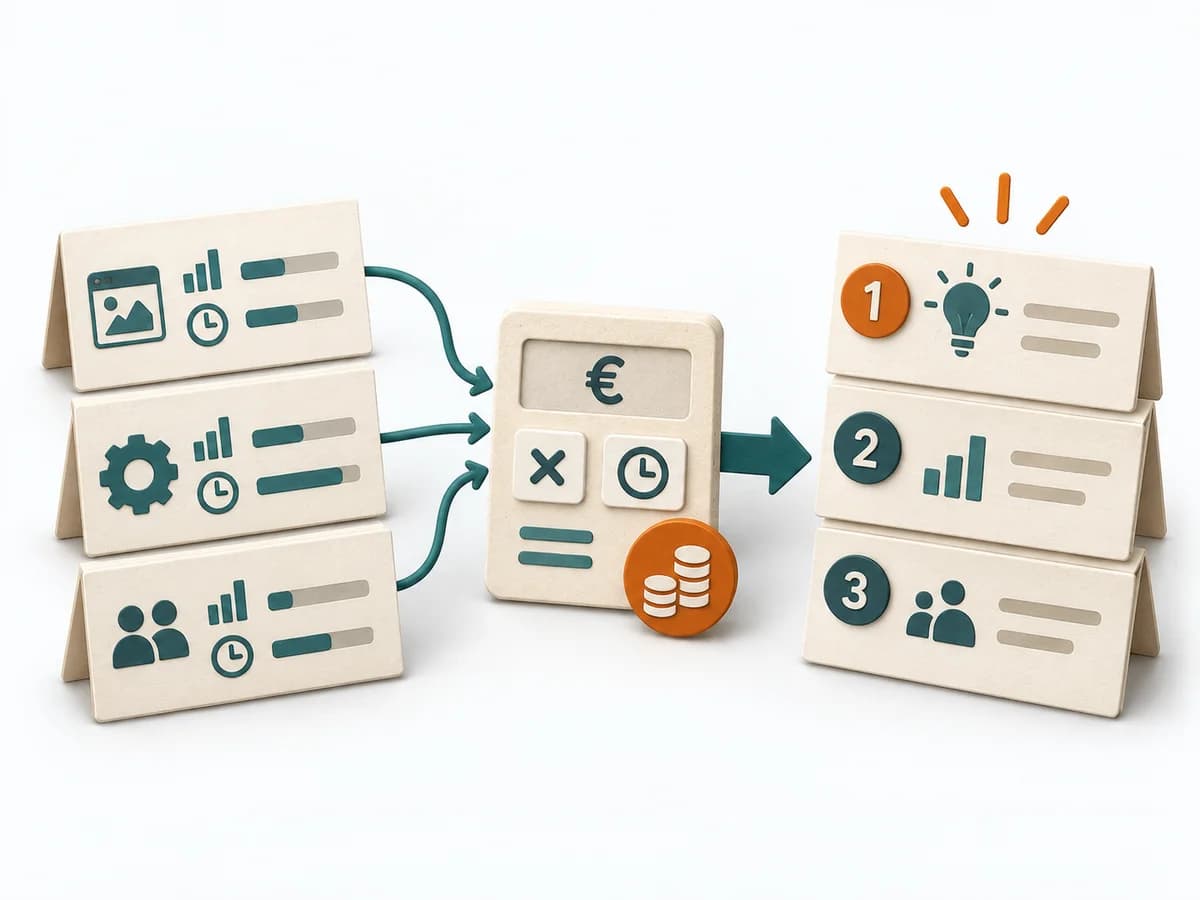
Purposedifferent | When features need to be distinguished by their effect on satisfaction, it makes expectations and surprises comparable. It separates basic needs, performance contribution, and delight. | For a complex deviation with several people involved, the method bundles problem, analysis, and decision onto one page. It creates a shared working space where causes, countermeasures, and follow-up fit together. | When ideas need sorting quickly, it condenses impact, confidence, and effort into one compact score. It connects customer value, product logic, and decision priorities. The result is captured as an ICE table and top-ideas list. |
Complexitydifferent | Medium | Medium | Low |
Timedifferent | 1-2 Tage | 45-90 min | 30-60 min |
Participantsdifferent | 10-50 | 2-5 | 2-8 |
Formatsame | Workshop + async | Workshop + async | Workshop + async |
Outputdifferent | Kano Matrix, Feature Classes, Priority Themes | A3 Report, Action Plan, Root Cause Analysis | ICE Table, Top Idea List |
Tagsno overlap | SatisfactionPrioritizationCustomer | LeanProblem solvingCoachingOperations | PrioritizationScoringGrowthDecision |
Often compared together
Methods with strong topical overlap with the current selection, not yet in the comparison.