View methods side by side.
Choose up to four methods. Add them using the search and share the comparison by copying its link.
| Criterion |  UX Research Customer Journey Mapping | 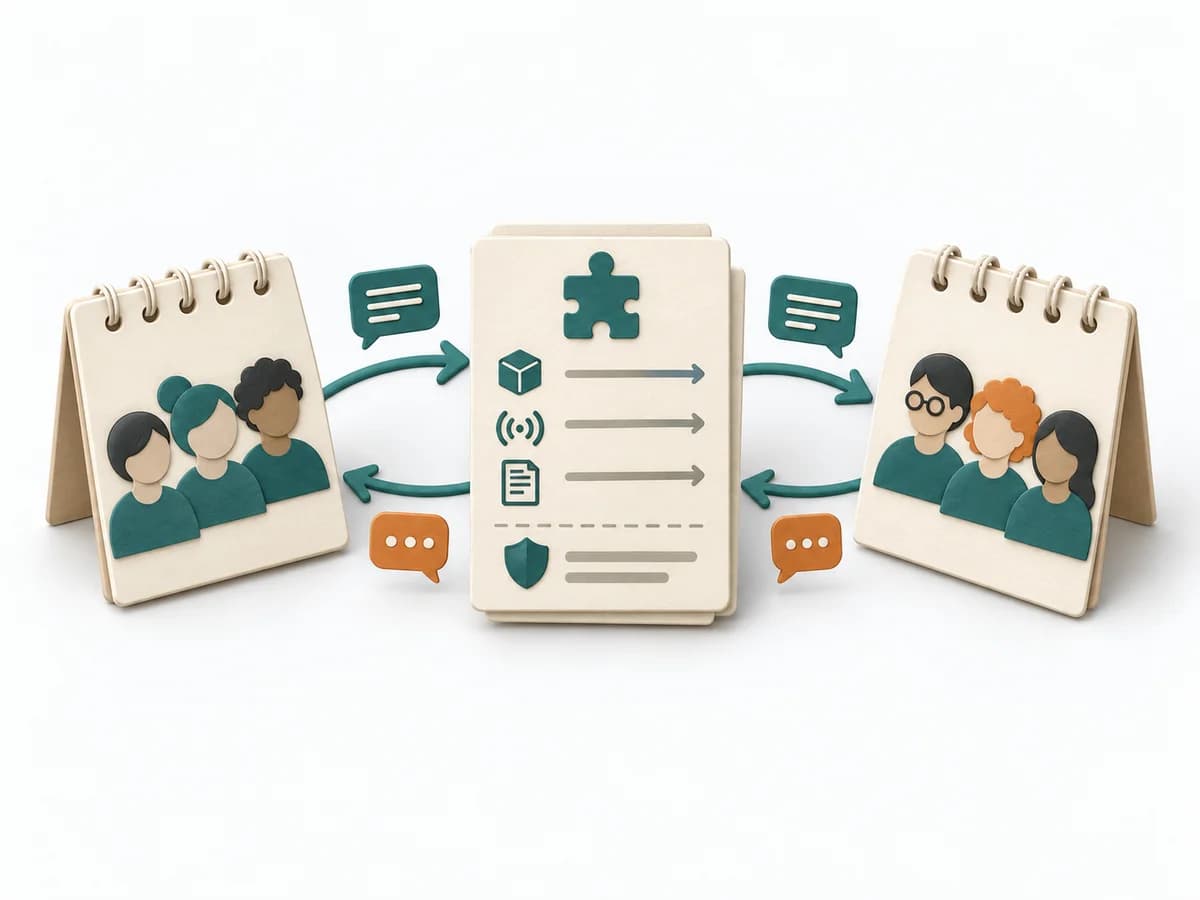 Team Design Team API | 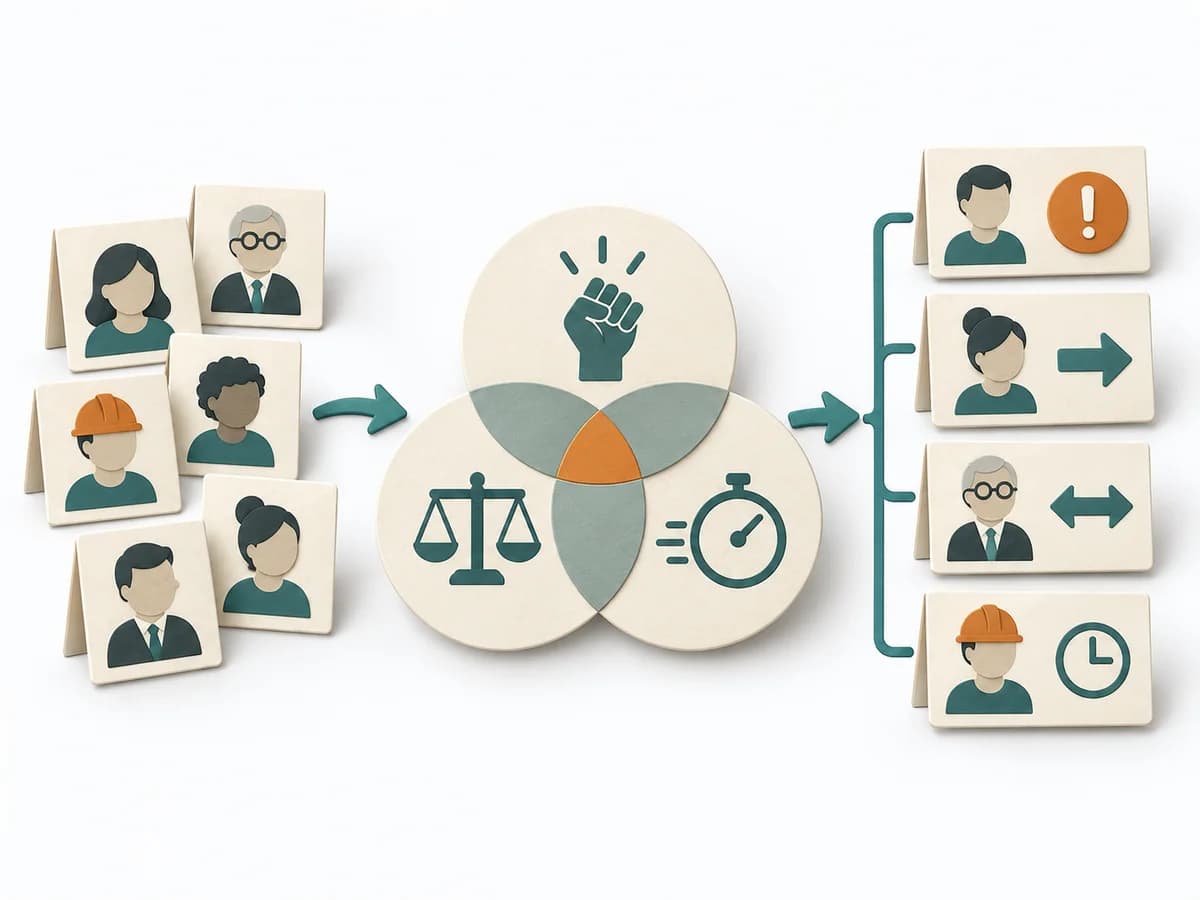 Facilitation Stakeholder Salience Model |
|---|---|---|---|
Purposedifferent | When a user journey falls apart across many touchpoints, customer journey mapping makes the experience visible as a coherent arc. Phases, emotions, and breaks become legible enough to prioritize critical moments deliberately. | When expectations between teams stay fuzzy, it describes how a team can be reached, used, and held accountable. It clarifies responsibility, interaction, and load between teams. The result is captured as a Team API document. | When stakeholders appear to matter very differently, the Stakeholder Salience Model rates their actual priority through power, legitimacy, and urgency. It turns individual contributions into a visible selection. The result is captured as a Salience diagram and a class-based strategy. |
Complexitydifferent | Medium | Low | Medium |
Timedifferent | 2-4 h | Half day initial, dann laufend | 60-90 min |
Participantsdifferent | 4-10 | Ein Team plus Stakeholder | 3-6 |
Formatdifferent | Workshop | Workshop + async | Workshop |
Outputdifferent | Journey Map, Pain-point List, Opportunity Backlog | Team API Document | Salience Diagram, Strategy per Class |
Tagsno overlap | JourneyServiceService design | TeamAlignmentCommunicationService | StakeholdersFacilitationAlignmentGovernance |
Often compared together
Methods with strong topical overlap with the current selection, not yet in the comparison.



