View methods side by side.
Choose up to four methods. Add them using the search and share the comparison by copying its link.
| Criterion |  UX Research Customer Journey Mapping | 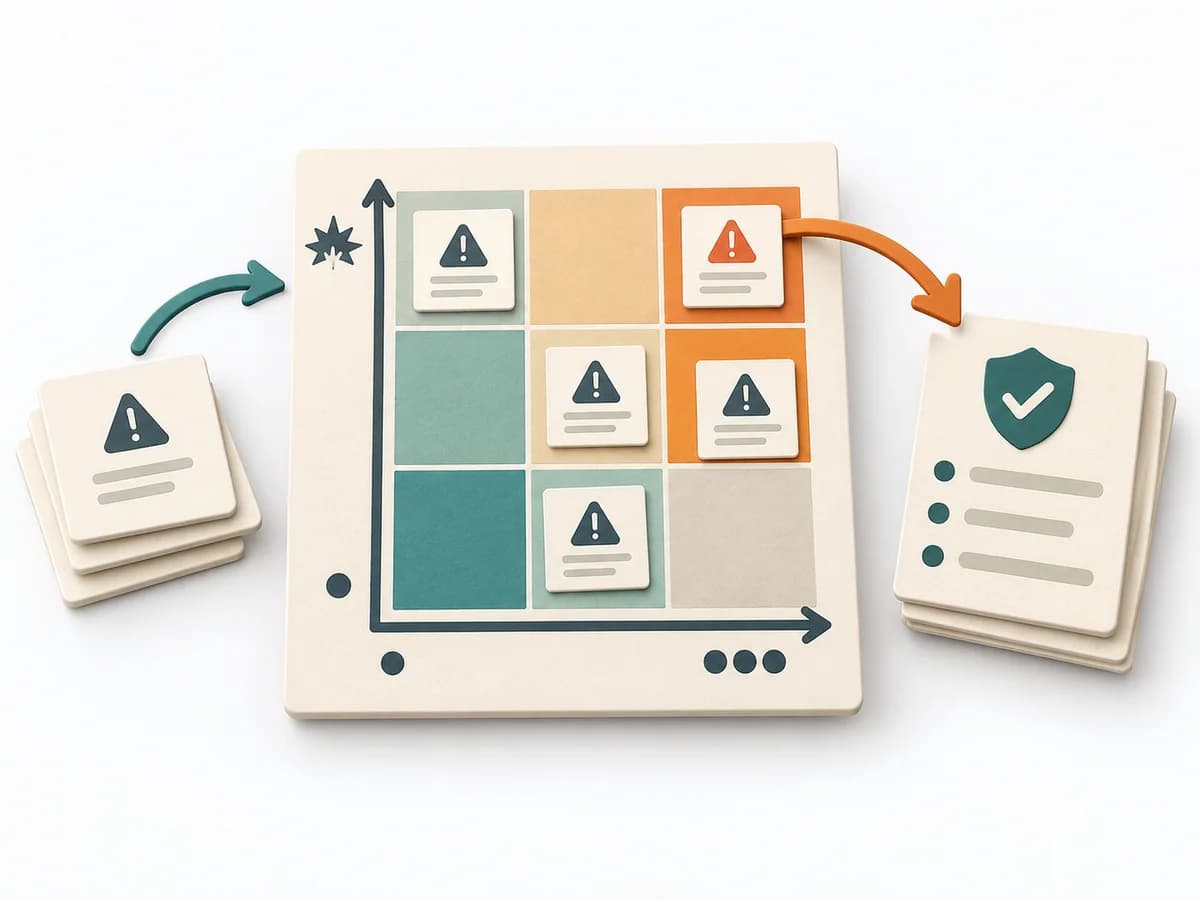 Decision Making Risk Matrix | 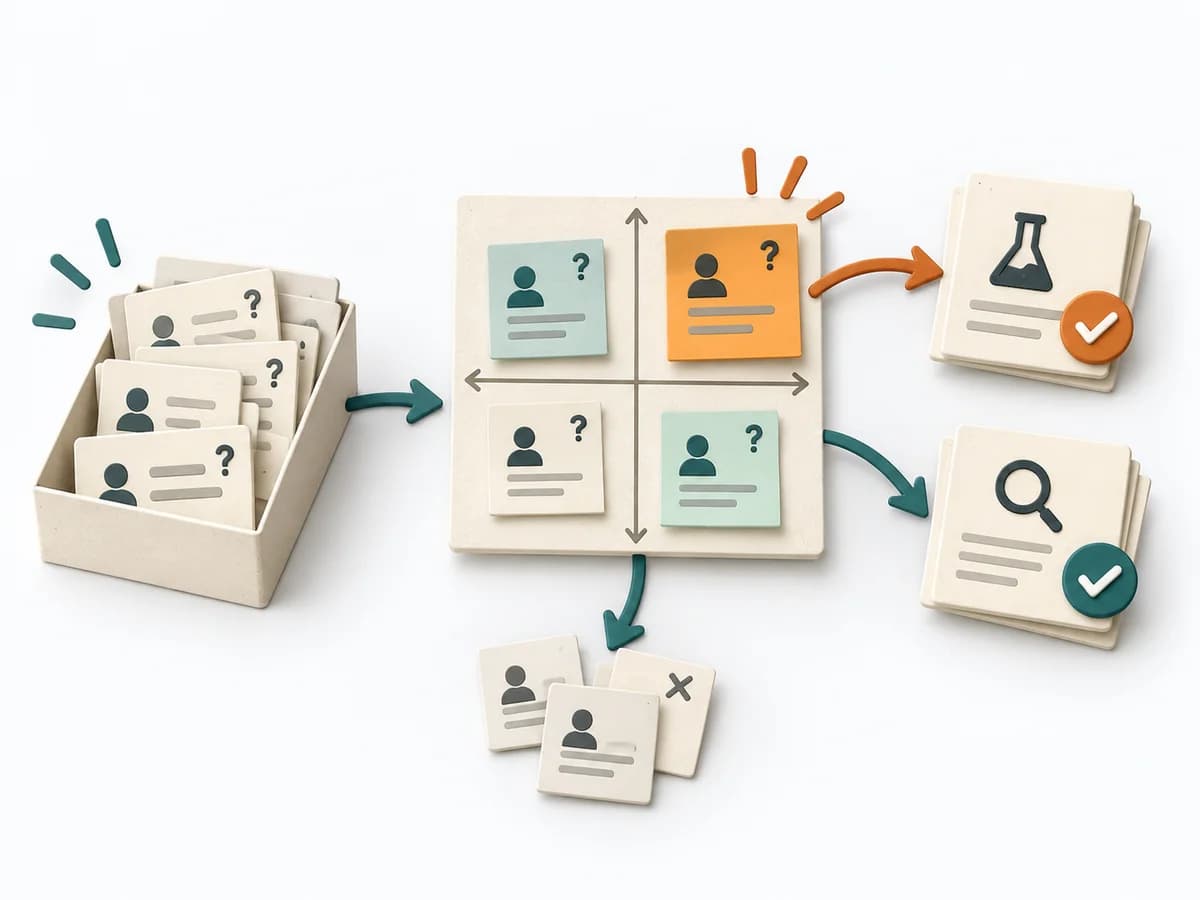 Decision Making Assumption Surfacing |
|---|---|---|---|
Purposedifferent | When a user journey falls apart across many touchpoints, customer journey mapping makes the experience visible as a coherent arc. Phases, emotions, and breaks become legible enough to prioritize critical moments deliberately. | When a project faces many possible disruptions, it quickly becomes unclear which risks deserve attention first. It separates options, evaluation criteria, and open risks. The result is captured as a Risk Matrix and a Top Risk List. | Plans often contain assumptions that were never openly stated and remain dangerous precisely because of that. Assumption Surfacing makes these silent premises visible and prioritizes which of them carry the initiative or could sink it. |
Complexitydifferent | Medium | Low | Low |
Timedifferent | 2-4 h | 30-60 min | 45-90 min |
Participantsdifferent | 4-10 | 3-10 | 2-8 |
Formatdifferent | Workshop | Workshop + async | Workshop + async |
Outputdifferent | Journey Map, Pain-point List, Opportunity Backlog | Risk Matrix, Top Risk List | Assumption List, Critical Assumptions, Learning Plan |
Tagsno overlap | JourneyServiceService design | RiskDecisionPrioritizationAssessment | AssumptionsRiskDecisionDiscovery |
Often compared together
Methods with strong topical overlap with the current selection, not yet in the comparison.