View methods side by side.
Choose up to four methods. Add them using the search and share the comparison by copying its link.
| Criterion |  DevOps Incident Timeline Analysis | 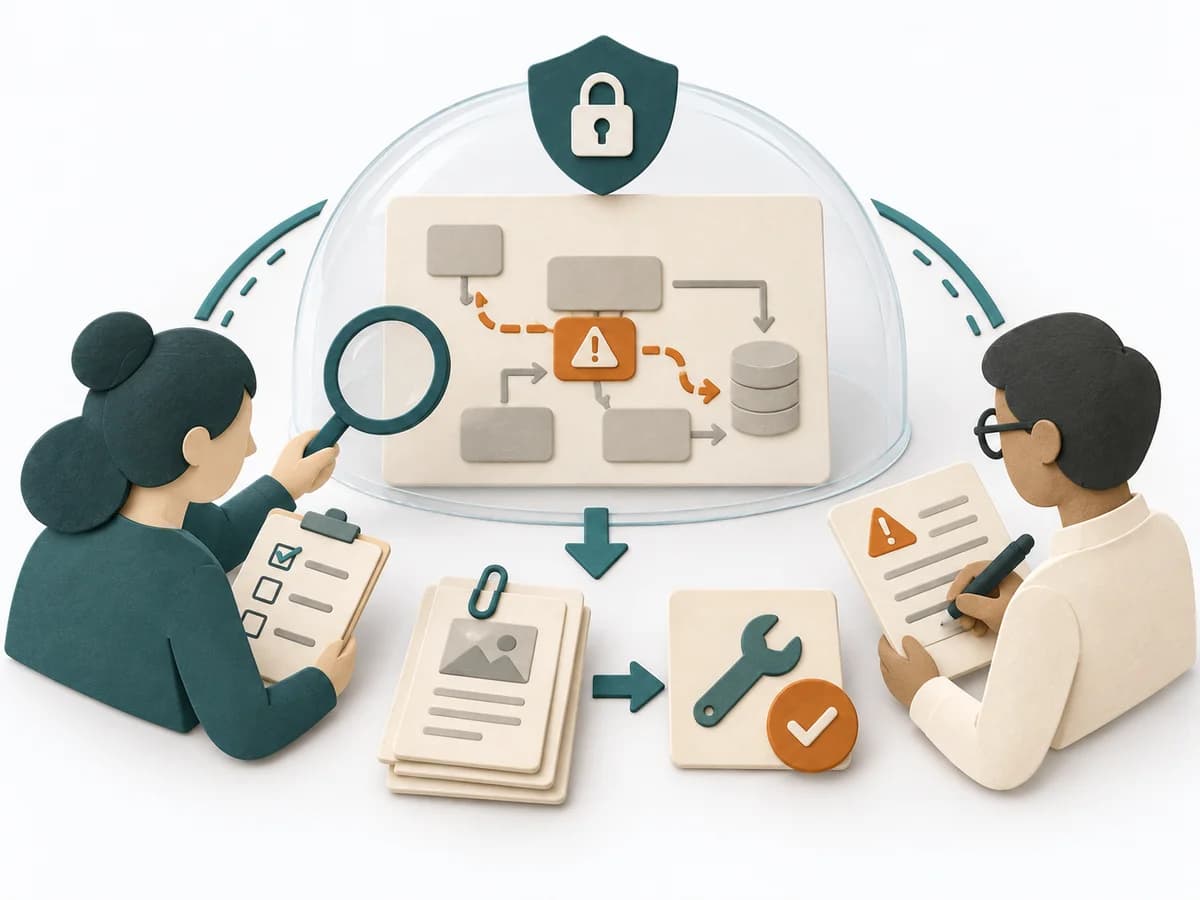 Decision Making Red Teaming |  Operations Causal Factor Analysis |
|---|---|---|---|
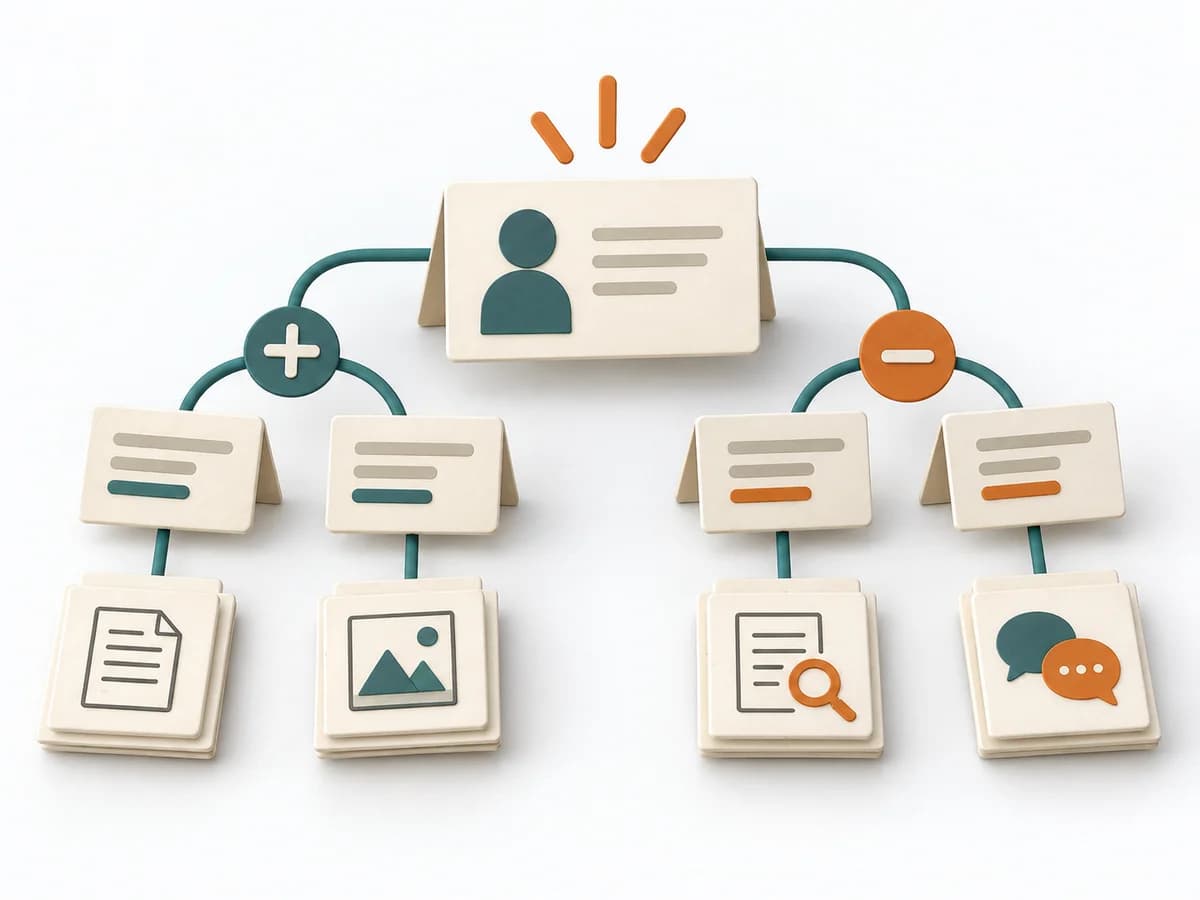
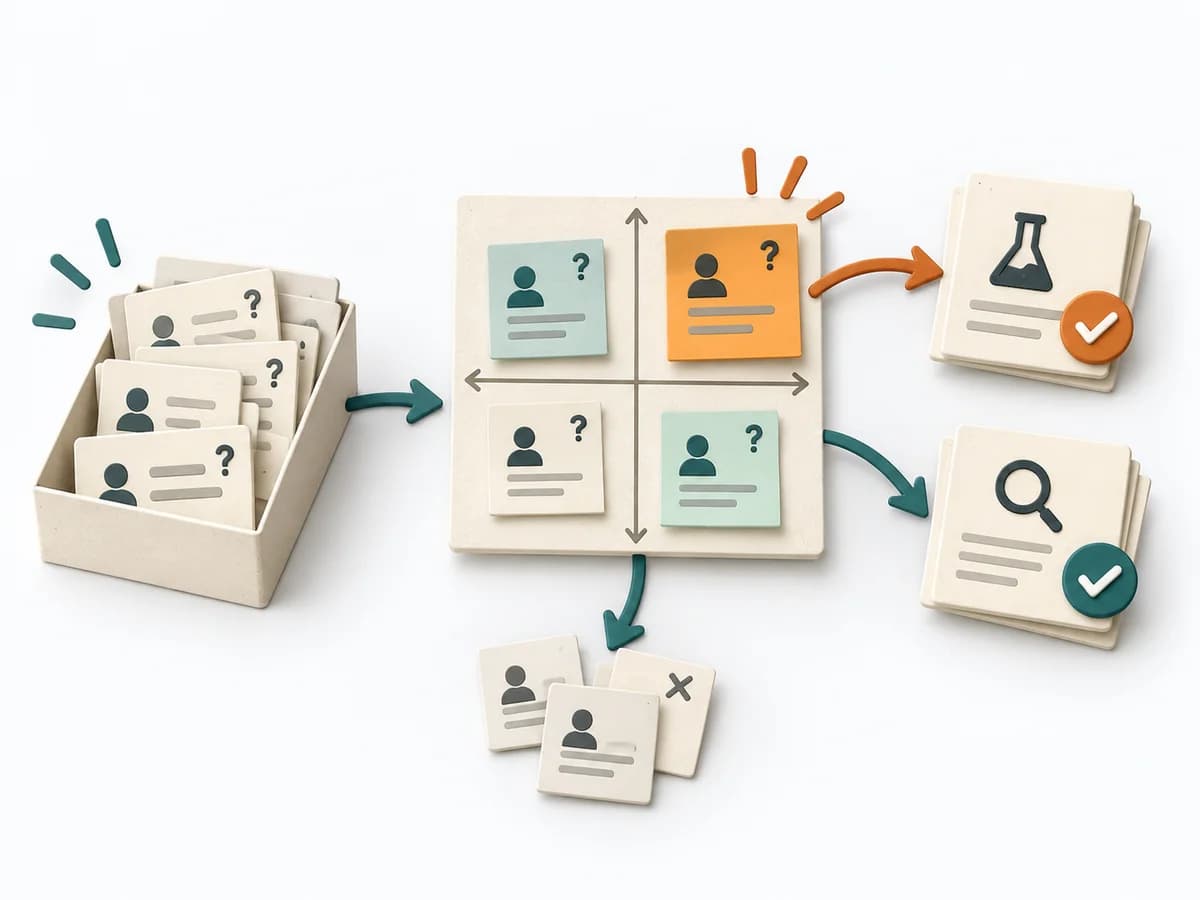
Purposedifferent | For an incident with an unclear sequence, the method makes the timeline precisely visible. It separates perception, reaction, and delay so cause and effect become more clearly readable. | For strategic decisions with high reach, agreement and gut feeling are often not enough. Red teaming brings deliberate opposition into the situation and tests where a plan breaks under real counterarguments. | For an event with a complicated course, the method breaks down the contributing factors along the timeline. It shows how conditions, decisions, and reactions together produce a course of events. |
Complexitydifferent | Medium | High | High |
Timedifferent | 60-180 min | 1-4 h | 2-6 h |
Participantsdifferent | 3-10 | 3-8 | 3-10 |
Formatdifferent | Workshop + async | Workshop | Workshop + async |
Outputdifferent | Incident Timeline, Evidence Log, Delay Analysis, Improvement Actions | Challenge Findings, Risk Register, Mitigation Plan | Event Timeline, Causal Factor Chart, Cause List, Corrective Actions |
Tagsno overlap | IncidentTimelineSite Reliability Engineering | RiskDecisionSensemaking | CausalityIncidentRoot causeTimeline |
Often compared together
Methods with strong topical overlap with the current selection, not yet in the comparison.