View methods side by side.
Choose up to four methods. Add them using the search and share the comparison by copying its link.
| Criterion |  Product Strategy Impact Mapping | 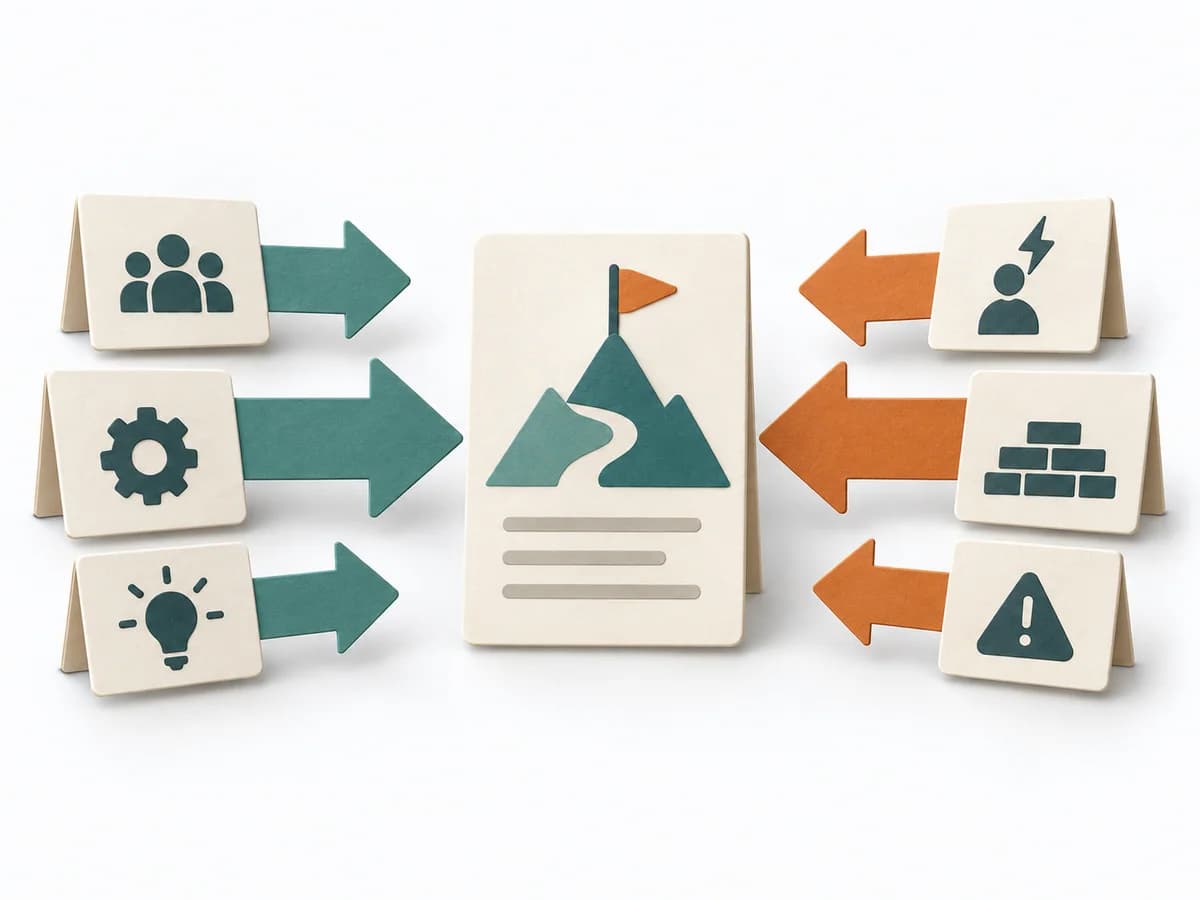 Decision Making Force Field Analysis |  Systems Thinking Behavior Over Time Graph |
|---|---|---|---|
Purposedifferent | When a goal needs to be connected to several possible paths, it shows chains of impact instead of feature lists. It connects business goal, behavior change, and measures. | In change initiatives, supporting and restraining forces sit at the table at the same time. Force Field Analysis makes these tensions explicit and shows where change can be pushed forward by strengthening or relieving. | A Behavior Over Time Graph shows how a metric or observation develops over time. The method makes trends, breaks, and recurring patterns visible that get lost in snapshots. |
Complexitydifferent | Medium | Low | Low |
Timedifferent | 45-90 min | 45-90 min | 20-45 min |
Participantsdifferent | 3-8 | 3-12 | 1-10 |
Formatdifferent | Workshop | Workshop | Workshop + async |
Outputdifferent | Impact Map, Outcome Hypotheses, Delivery Options | Force Field Map, Change Levers, Risk Notes | Behavior Over Time Graph, Trend Hypotheses, Key Events |
Tagsno overlap | OutcomesStrategyBehaviorPlanning | ChangeDecisionStrategy | Systems thinkingPatternsDynamics |
Often compared together
Methods with strong topical overlap with the current selection, not yet in the comparison.