View methods side by side.
Choose up to four methods. Add them using the search and share the comparison by copying its link.
| Criterion |  Business Strategy GAP Analysis | 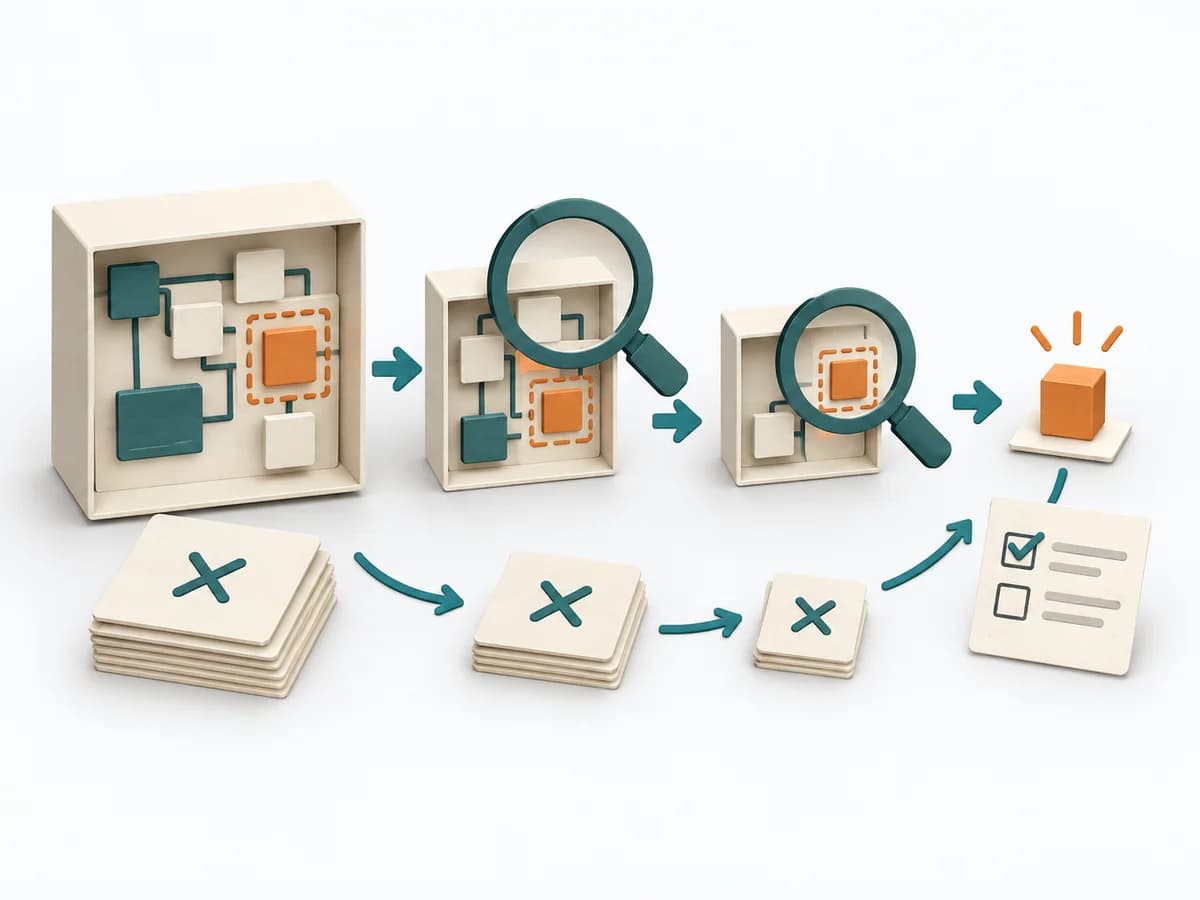 Engineering Fault Isolation | 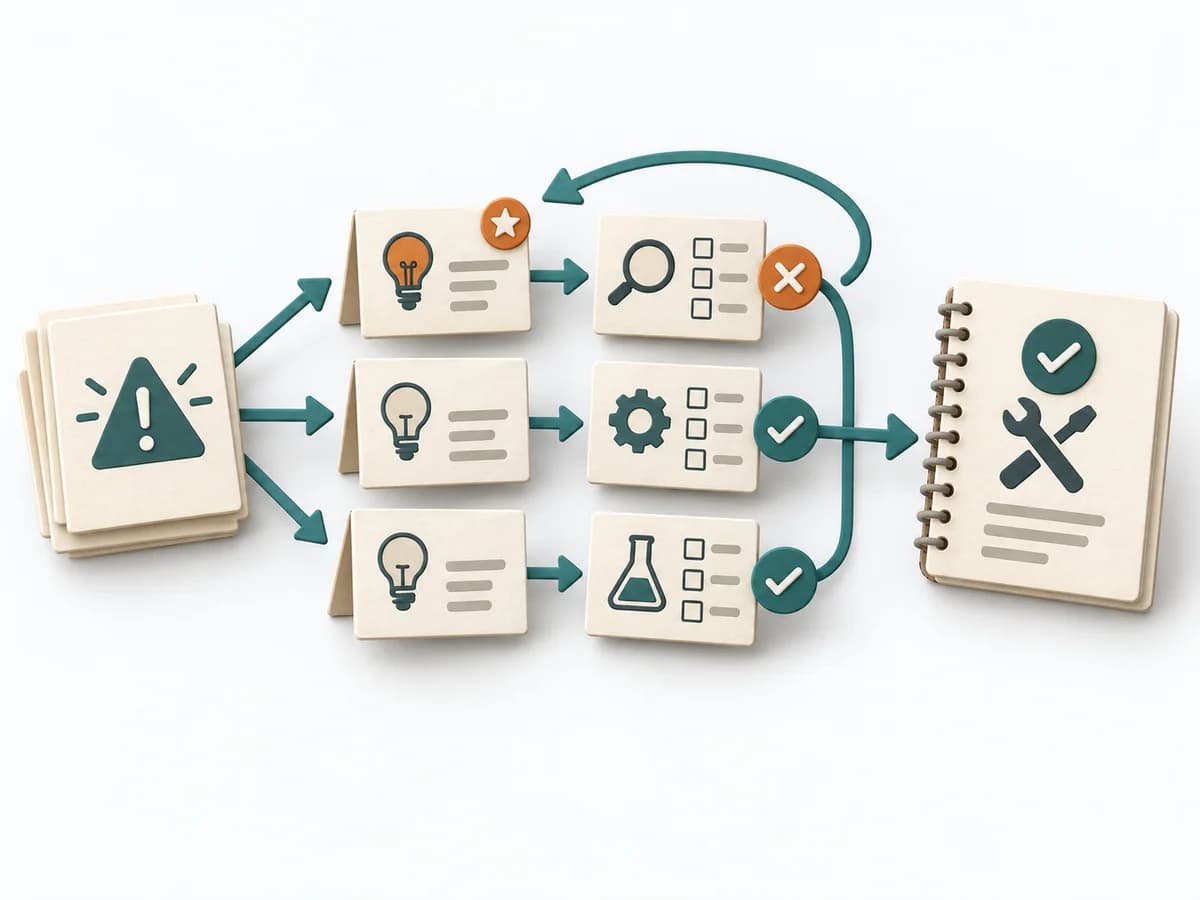 Engineering Hypothesis-Driven Troubleshooting |
|---|---|---|---|
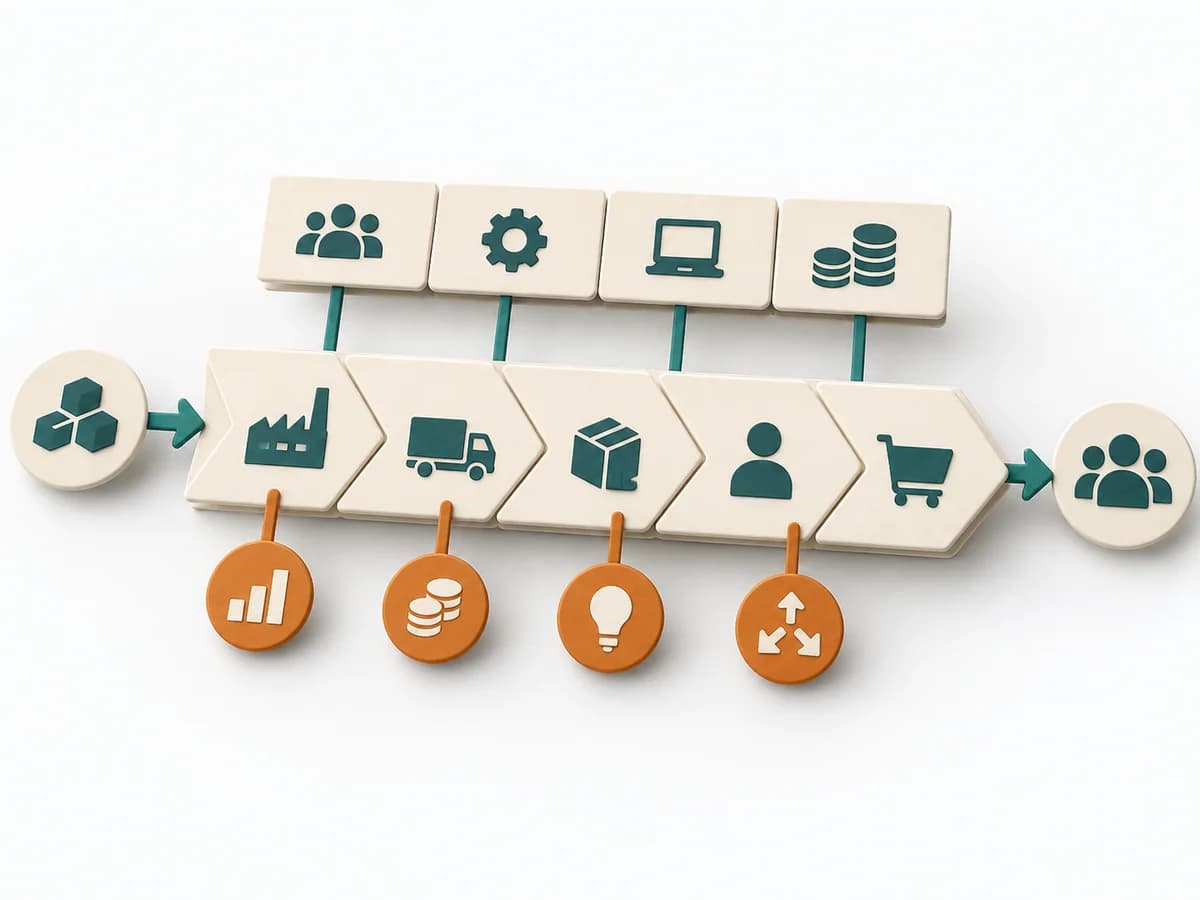
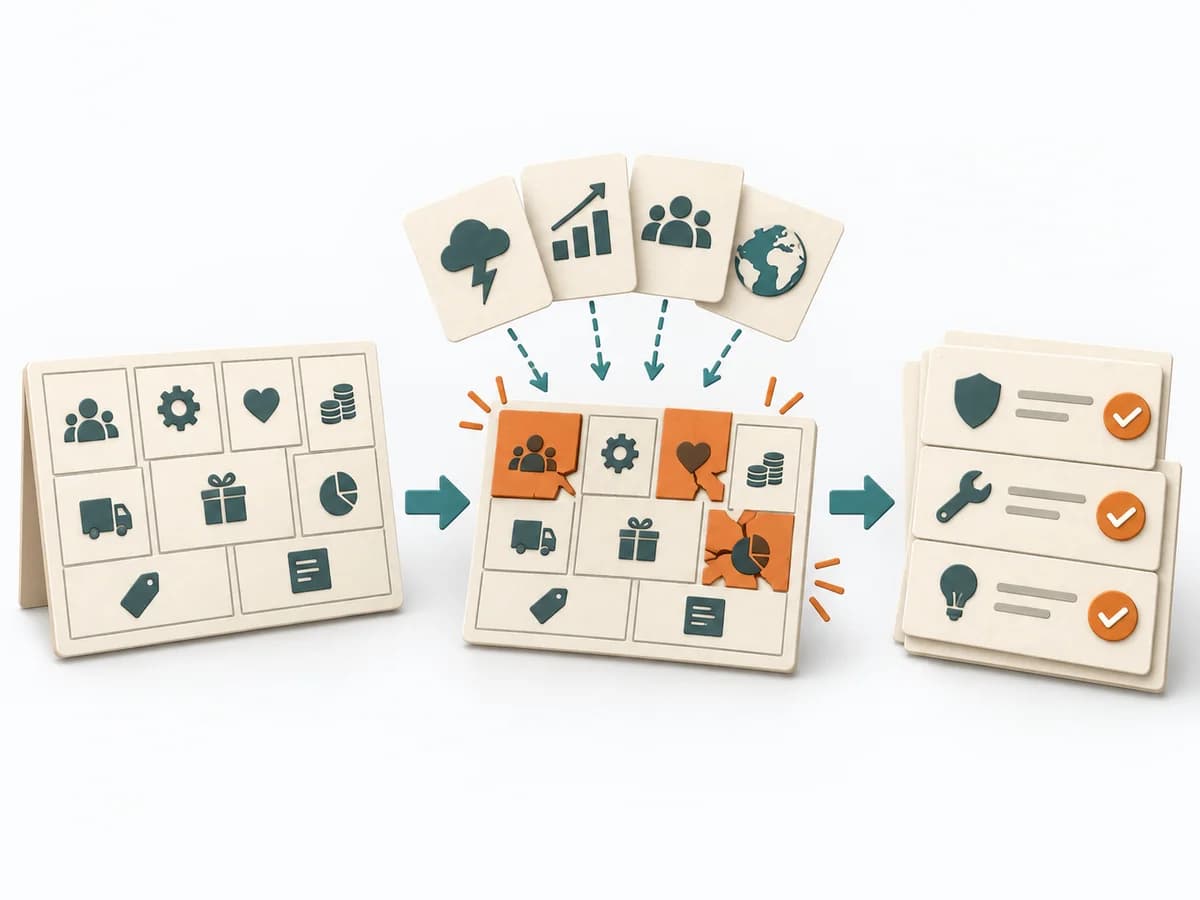
Purposedifferent | GAP Analysis compares the current state with a target picture and makes the distance manageable. It becomes useful when, ahead of new initiatives, it must become clear which capabilities, processes, or resources are missing. | In technical failures, the visible symptom often gets mixed up with the actual cause. Fault Isolation narrows the fault space and progressively reduces which part of the system is truly affected. | When systems fail unexpectedly, spontaneous attempts often produce more noise than insight. Hypothesis-driven Troubleshooting translates symptoms into testable assumptions and makes troubleshooting learnable. |
Complexitysame | Medium | Medium | Medium |
Timedifferent | 1-3 h | 30-180 min | 30-240 min |
Participantsdifferent | 2-8 | 1-6 | 1-6 |
Formatsame | Workshop + async | Workshop + async | Workshop + async |
Outputdifferent | Gap Matrix, Action Plan, Risk Notes | Fault Isolation Map, Test Log, Excluded Hypotheses, Narrowed Fault Area | Hypothesis Log, Test Plan, Evidence Notes, Diagnosis Summary |
Tagsno overlap | StrategyAnalysisPlanning | TroubleshootingDiagnosisEngineering | TroubleshootingProblem solvingDiagnosis |
Often compared together
Methods with strong topical overlap with the current selection, not yet in the comparison.