View methods side by side.
Choose up to four methods. Add them using the search and share the comparison by copying its link.
| Criterion |  Growth Flywheel |  Delivery Value Stream Mapping | 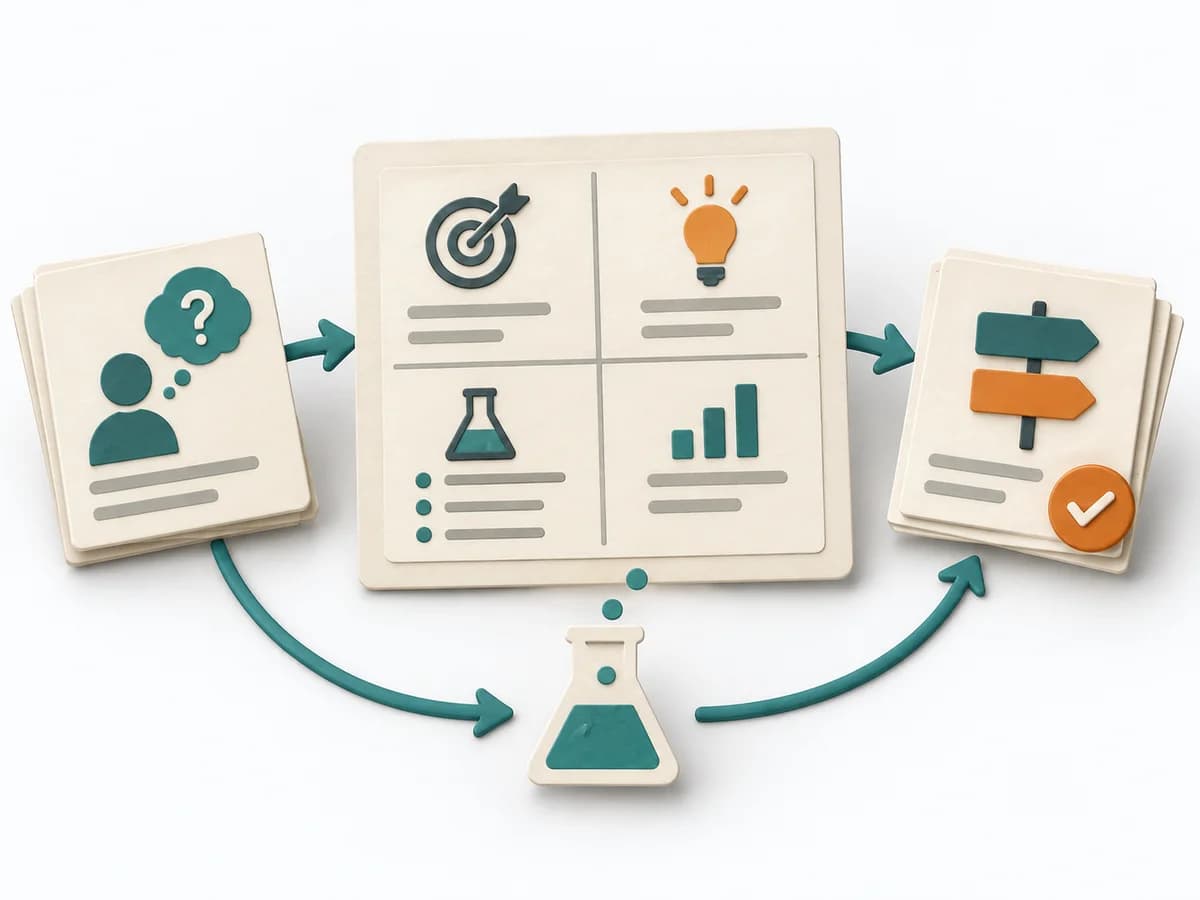 Product Discovery Experiment Canvas |
|---|---|---|---|
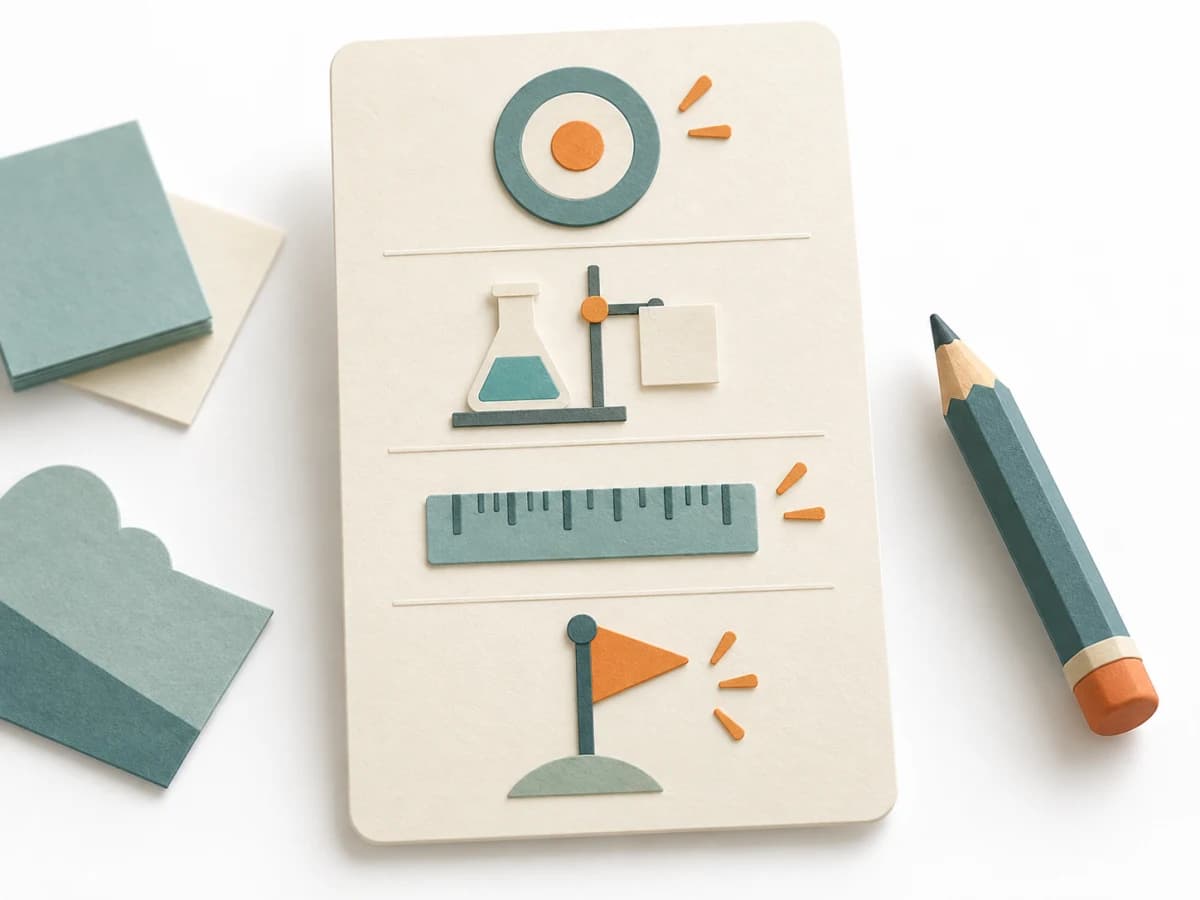
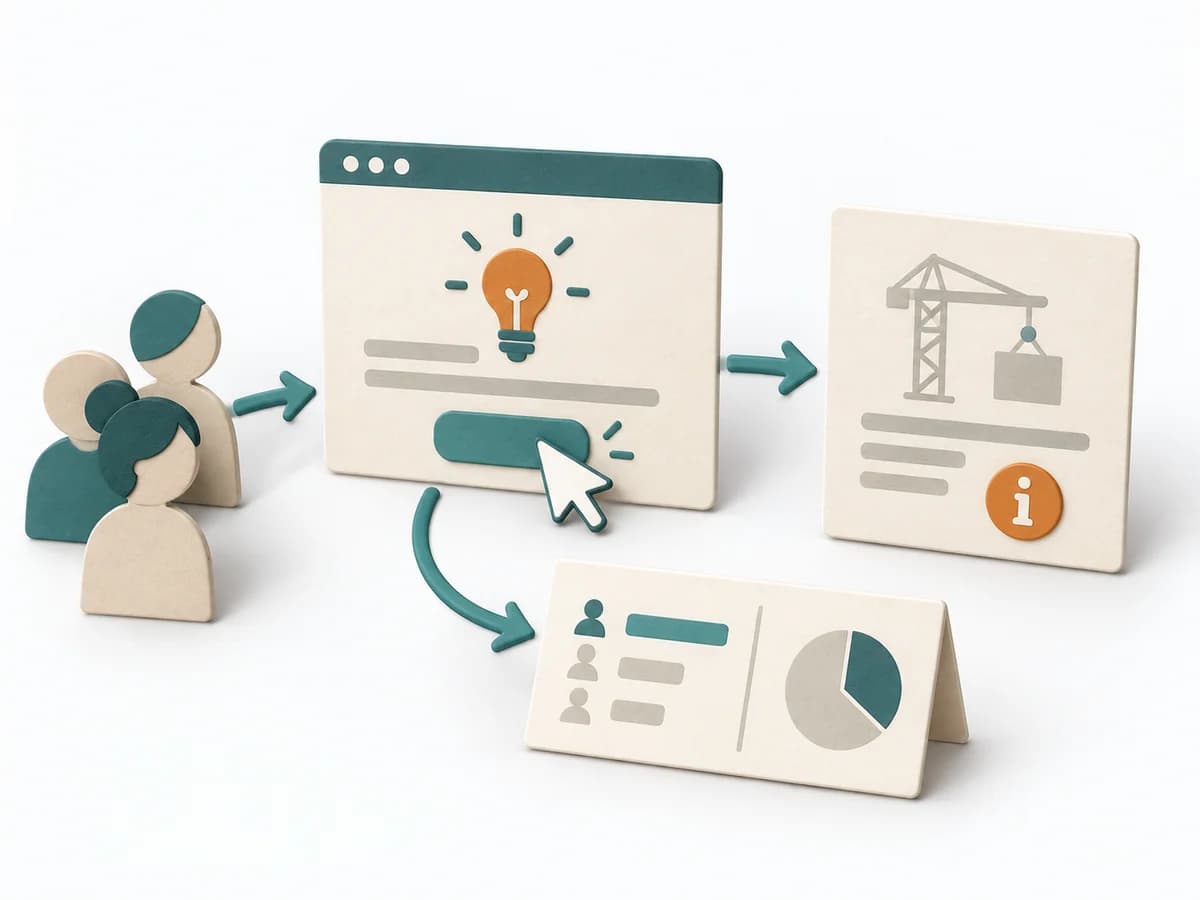
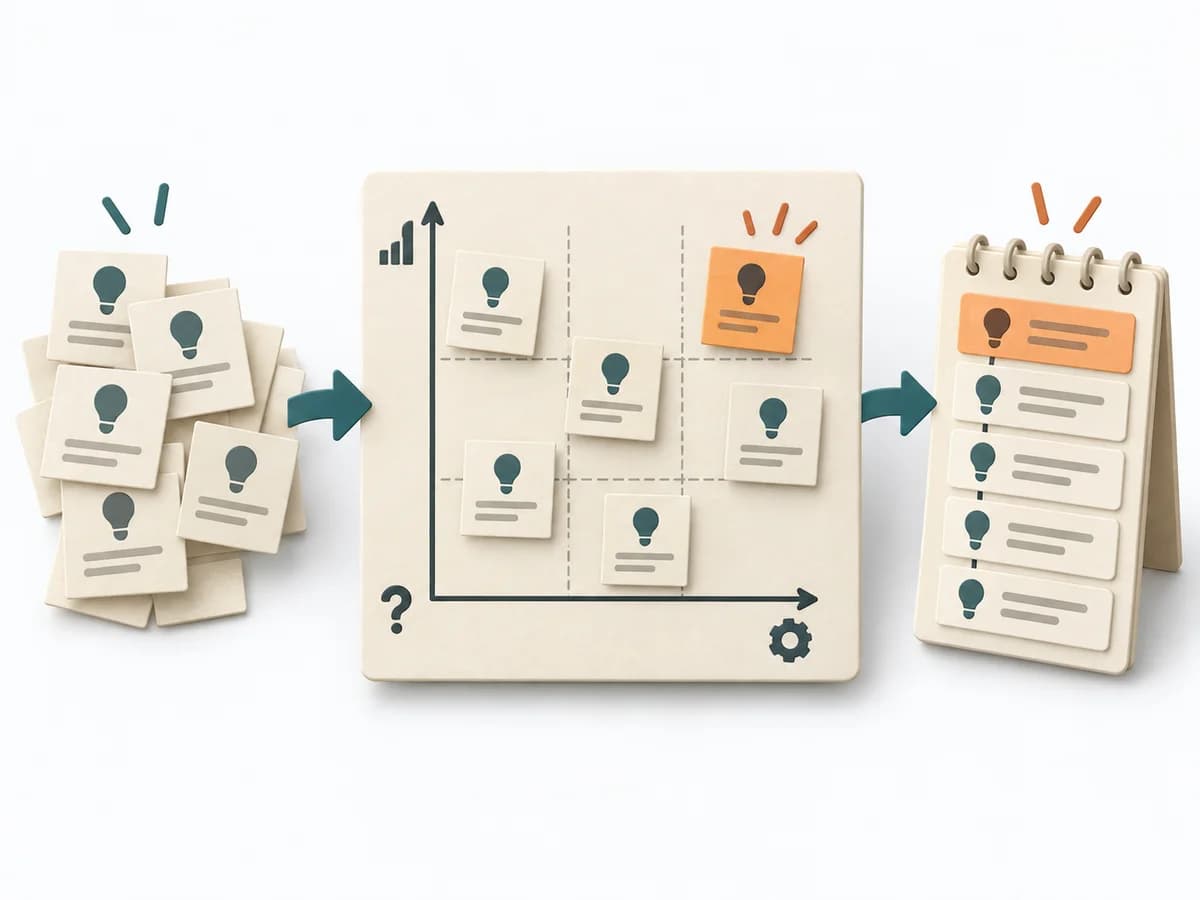
Purposedifferent | Growth often breaks down where a reinforcing mechanism builds up too much friction. A Flywheel shows the cycle of value, repetition, and reinforcement meant to sustain growth. | When delivery work dissolves into wait times, handoffs, and hidden effort, Value Stream Mapping makes the actual flow visible. The method exposes bottlenecks, idle time, and feedback loops so lead time and improvement levers become tangible. | When experiments become unreadable after the fact, it arranges hypothesis, signal, and learning goal on a single canvas. It separates problem, assumption, solution, and evidence. The result is captured as a Completed Experiment Canvas and a Success Metric. |
Complexitydifferent | Medium | Medium | Low |
Timedifferent | 60-120 min | 1-3 h | 30-60 min |
Participantsdifferent | 3-8 | 4-10 | 1-5 |
Formatdifferent | Workshop | Workshop | Workshop + async |
Outputdifferent | Flywheel Map, Friction Points, Growth Levers, Experiment Backlog | Current-state map, Future-state map, Bottleneck list | Completed Experiment Canvas, Success Metric |
Tagsno overlap | GrowthRetentionConversion | LeanFlowWasteDelivery | ExperimentsValidationDiscoveryHypothesis |
Often compared together
Methods with strong topical overlap with the current selection, not yet in the comparison.