View methods side by side.
Choose up to four methods. Add them using the search and share the comparison by copying its link.
| Criterion |  Growth Flywheel | 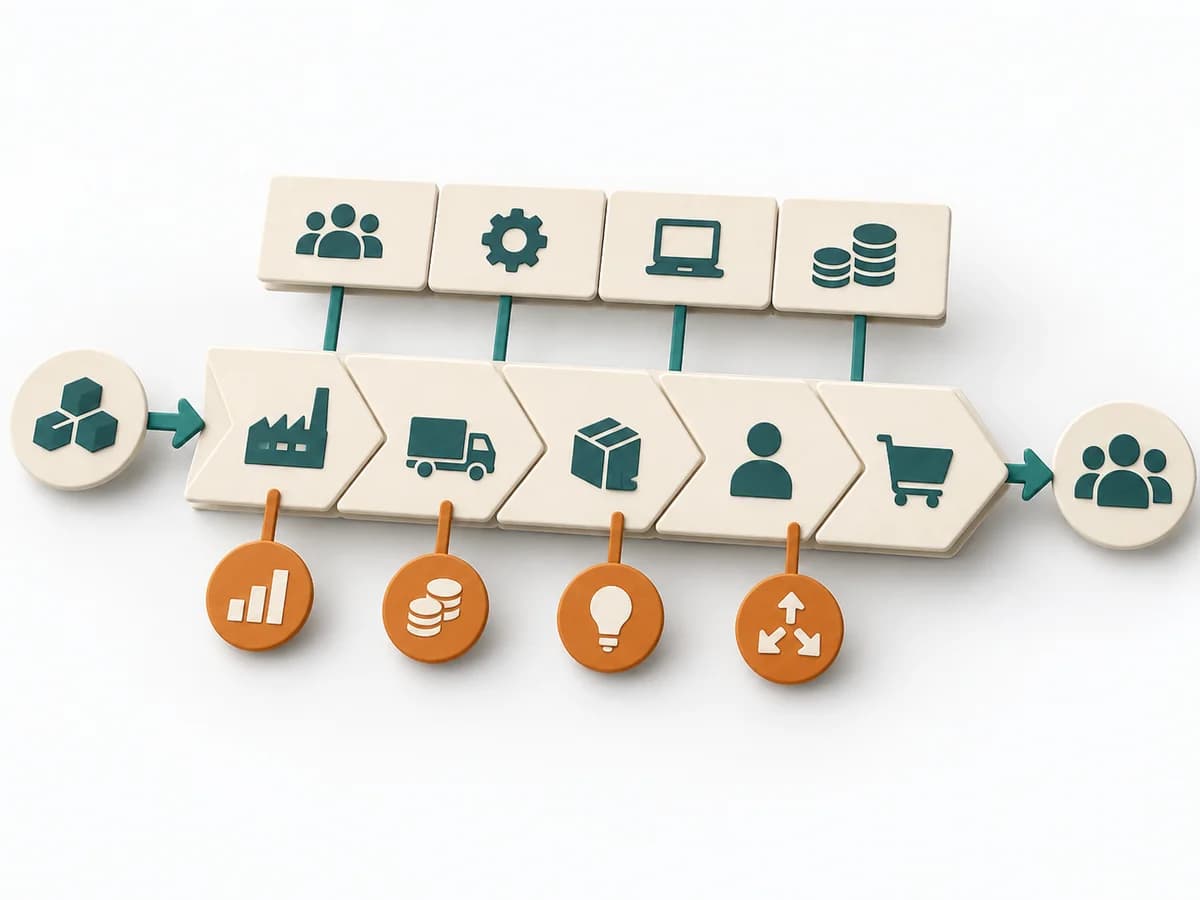 Business Strategy Value Chain Analysis | 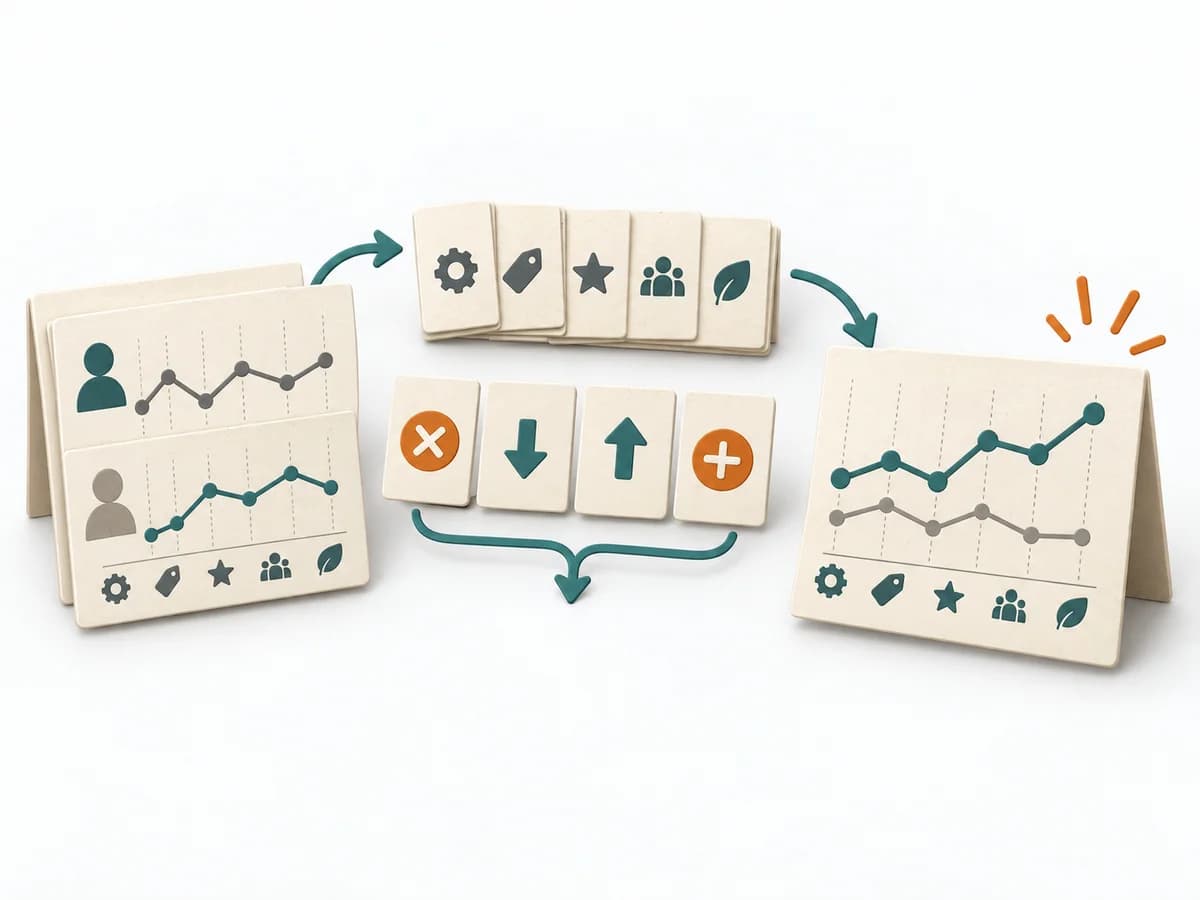 Business Strategy Blue Ocean Strategy Canvas |
|---|---|---|---|
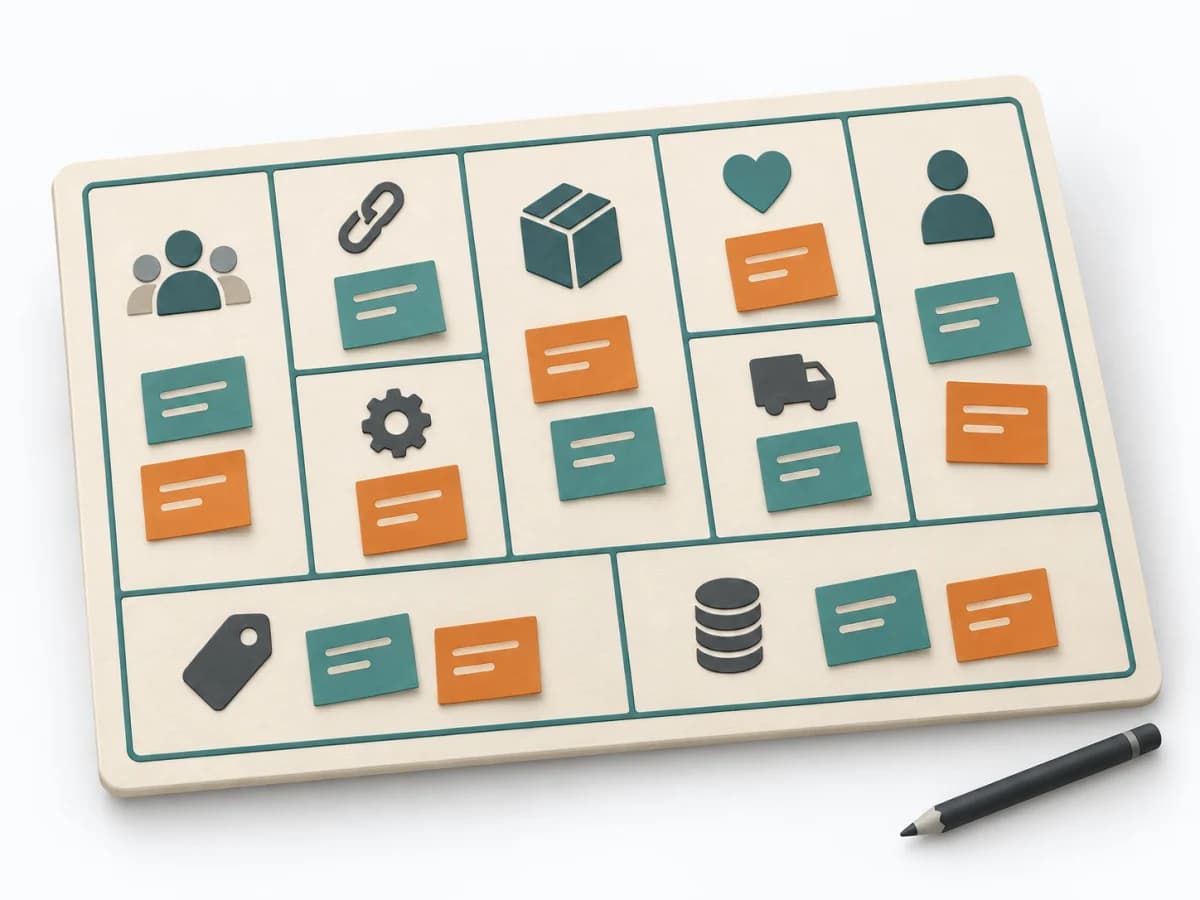
Purposedifferent | Growth often breaks down where a reinforcing mechanism builds up too much friction. A Flywheel shows the cycle of value, repetition, and reinforcement meant to sustain growth. | Value Chain Analysis shows where value is created, costs accrue, and differentiation becomes possible along the process. It compares strengths, risks, market logic, and courses of action. The result is captured as a value-chain map and lever list. | The Blue Ocean Strategy Canvas shows how an offering is positioned relative to the market. Differentiation thereby becomes tangible in value factors instead of merely being claimed. |
Complexitydifferent | Medium | High | Medium |
Timedifferent | 60-120 min | Half day | 2-4 h |
Participantsdifferent | 3-8 | 3-8 | 3-10 |
Formatsame | Workshop | Workshop | Workshop |
Outputdifferent | Flywheel Map, Friction Points, Growth Levers, Experiment Backlog | Value Chain Map, Lever List | Strategy Canvas, Value Curve, ERRC Actions |
Tagsno overlap | GrowthRetentionConversion | StrategyBusiness modelDiagnosisAnalysis | StrategyPositioningInnovationValue |
Often compared together
Methods with strong topical overlap with the current selection, not yet in the comparison.