View methods side by side.
Choose up to four methods. Add them using the search and share the comparison by copying its link.
| Criterion | 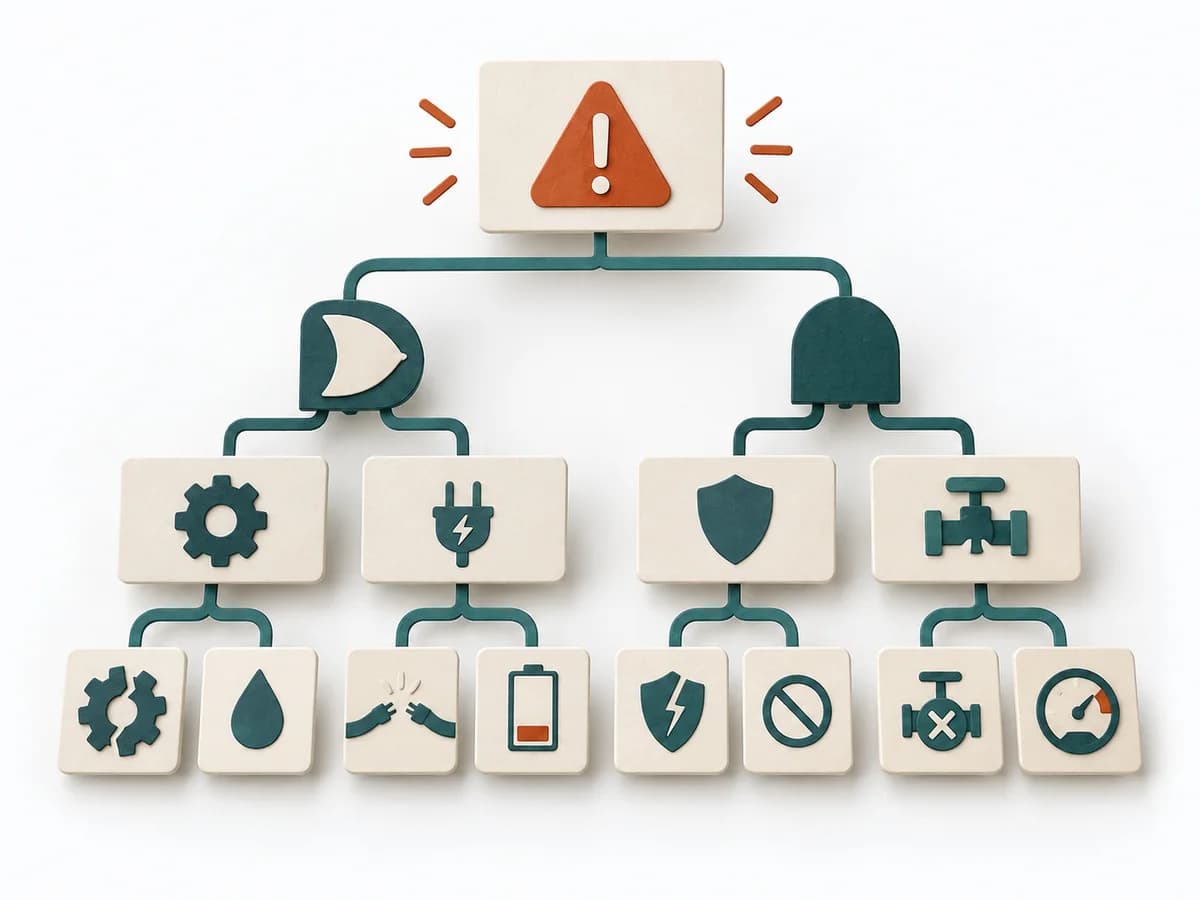 Operations Fault Tree Analysis |  Product Discovery Opportunity Scoring |  Decision Making Assumption Surfacing |
|---|---|---|---|
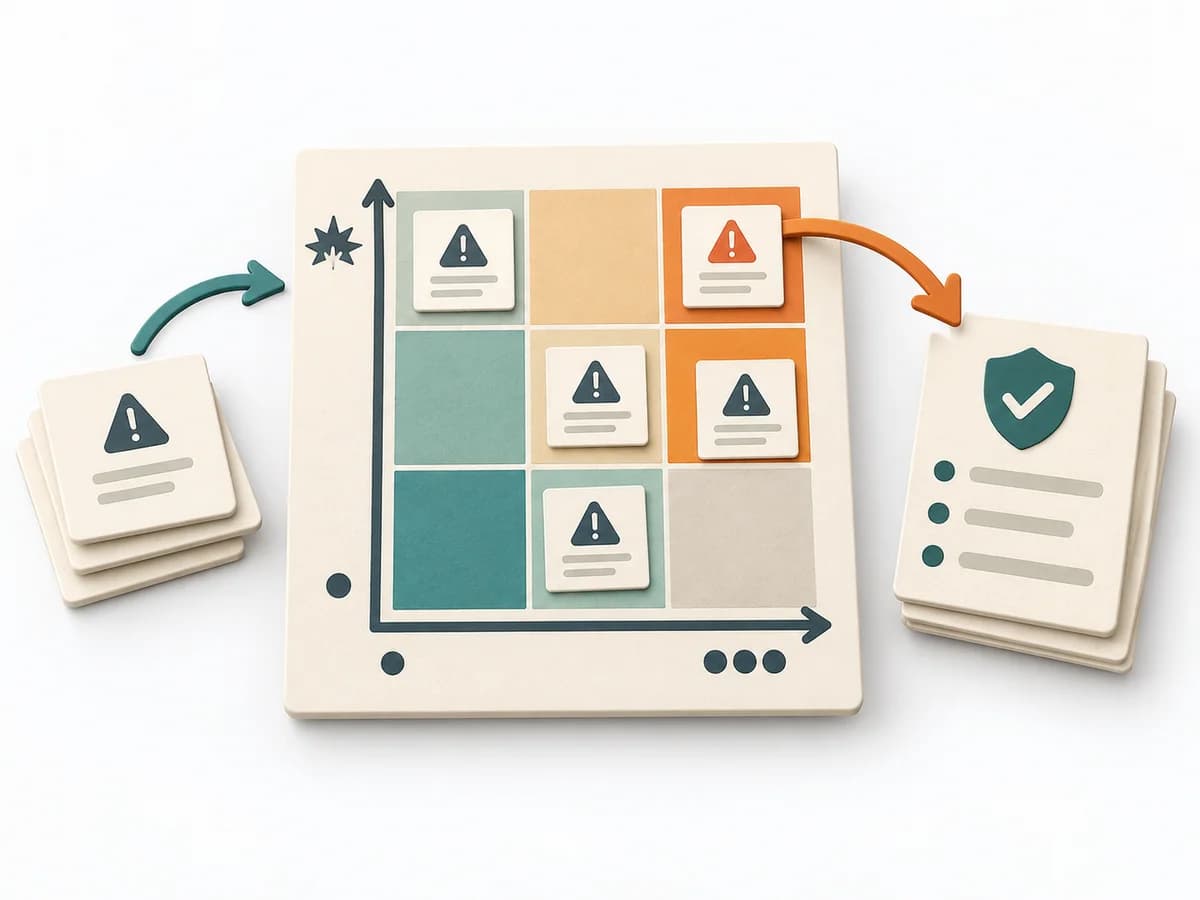
Purposedifferent | For a critical top event with several possible triggers, the method logically models failure paths. It makes visible which combinations of conditions can lead to damage. | When opportunities need ranking by their effect, it makes importance and satisfaction directly comparable. It separates problem, assumption, solution, and evidence. The result is captured as an opportunity-score table and top outcomes. | Plans often contain assumptions that were never openly stated and remain dangerous precisely because of that. Assumption Surfacing makes these silent premises visible and prioritizes which of them carry the initiative or could sink it. |
Complexitydifferent | High | Medium | Low |
Timedifferent | 2-6 h | 60-120 min | 45-90 min |
Participantsdifferent | 3-8 | 3-6 | 2-8 |
Formatsame | Workshop + async | Workshop + async | Workshop + async |
Outputdifferent | Fault Tree, Critical Paths, Cause Hypotheses, Control Actions | Opportunity Score Table, Top Outcomes | Assumption List, Critical Assumptions, Learning Plan |
Tagsno overlap | RiskRoot causeSafety | PrioritizationDiscoveryOutcomesNeeds | AssumptionsRiskDecisionDiscovery |
Often compared together
Methods with strong topical overlap with the current selection, not yet in the comparison.