View methods side by side.
Choose up to four methods. Add them using the search and share the comparison by copying its link.
| Criterion | 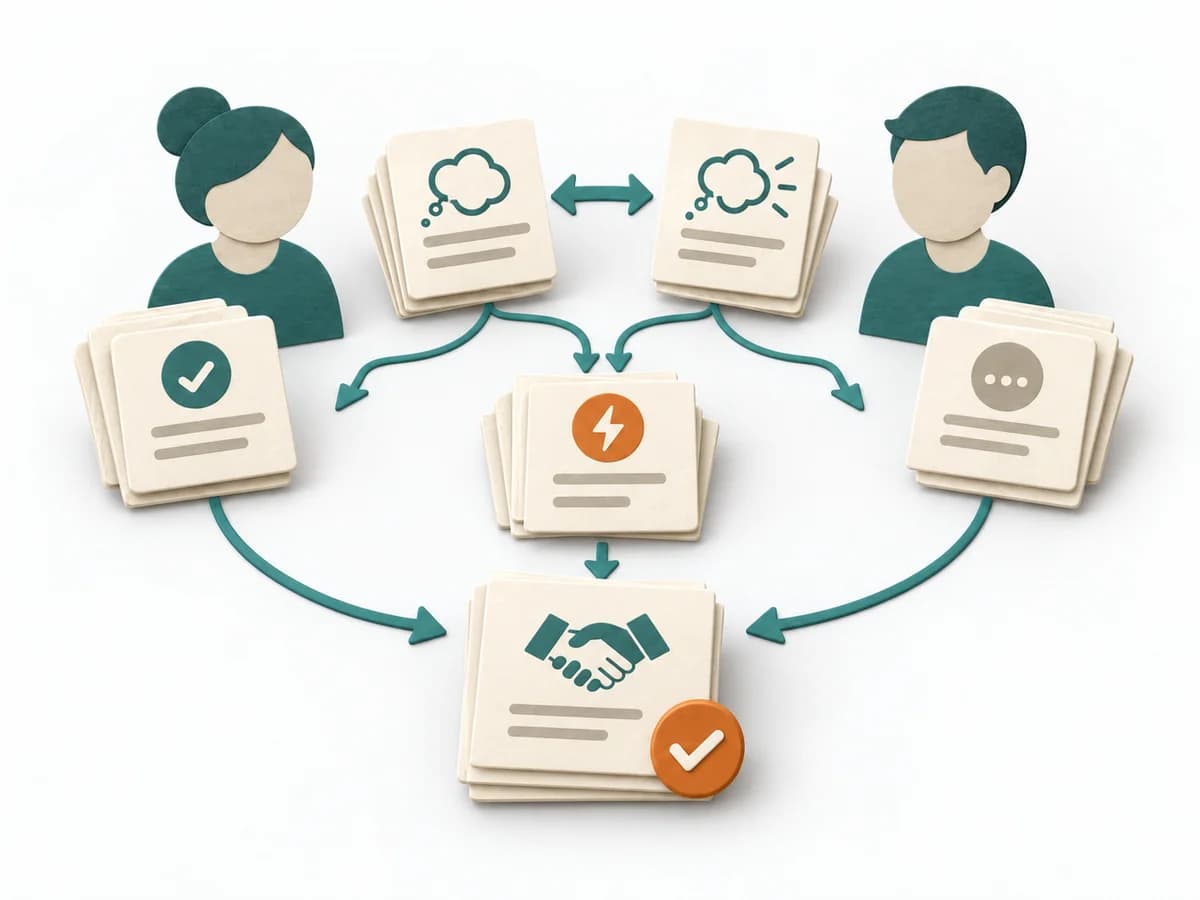 Facilitation Expectation Mapping | 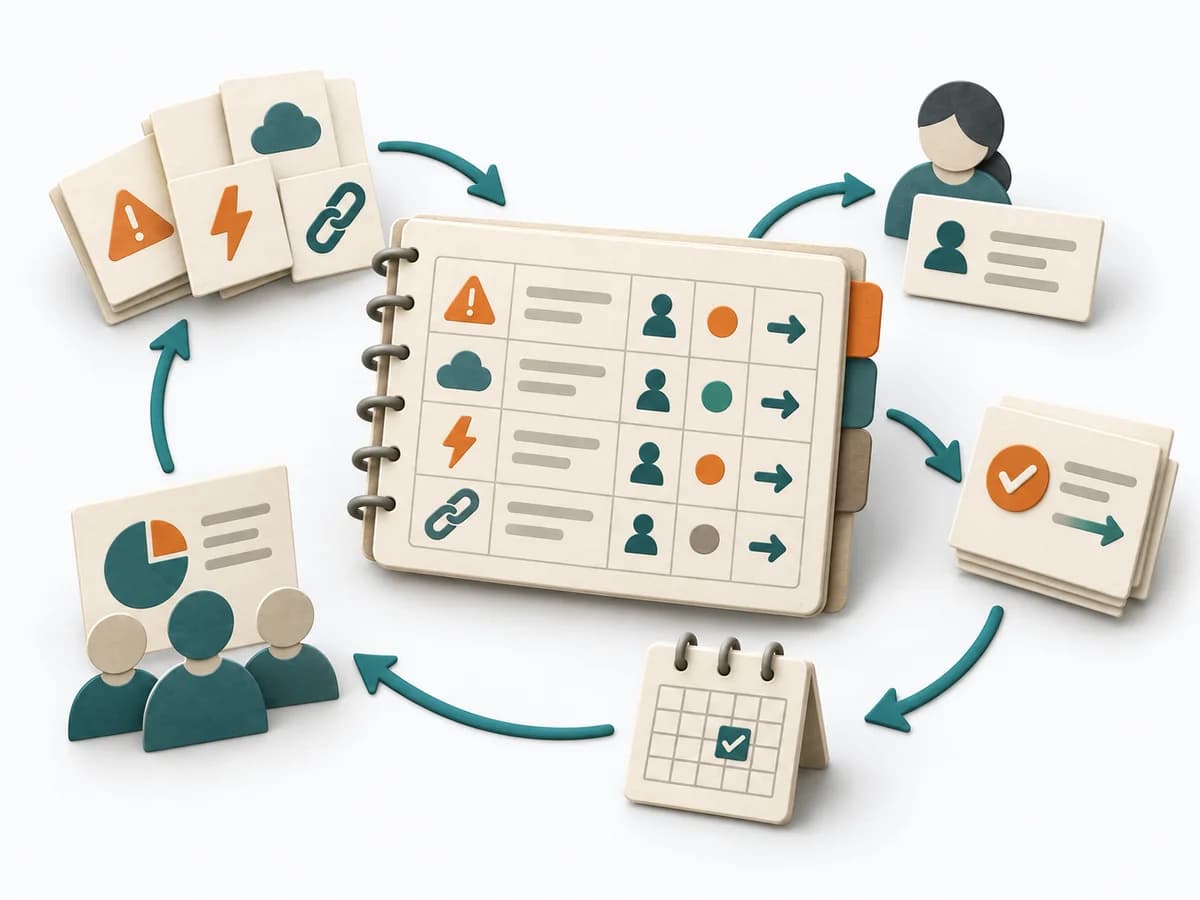 Delivery RAID Log | 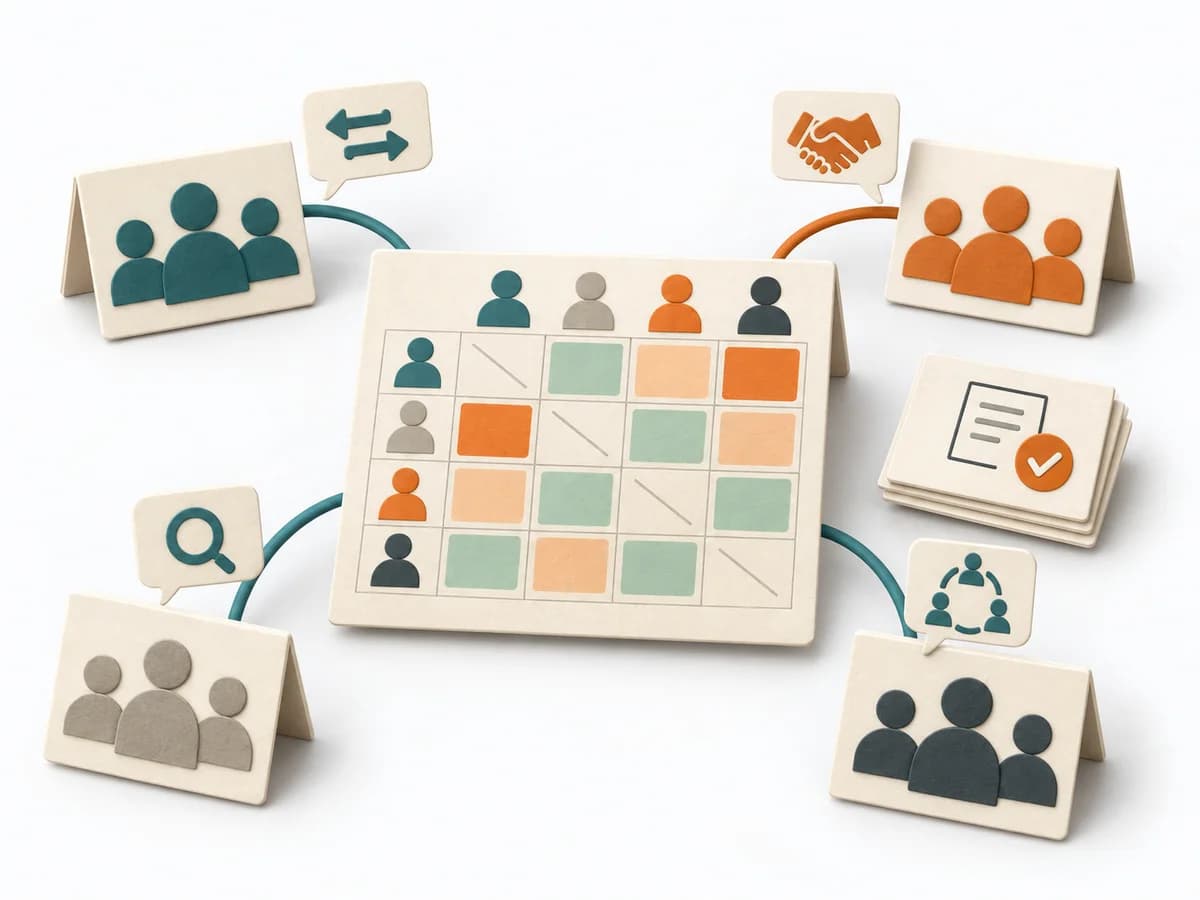 Team Design Team Topologies Interaction Modes |
|---|---|---|---|
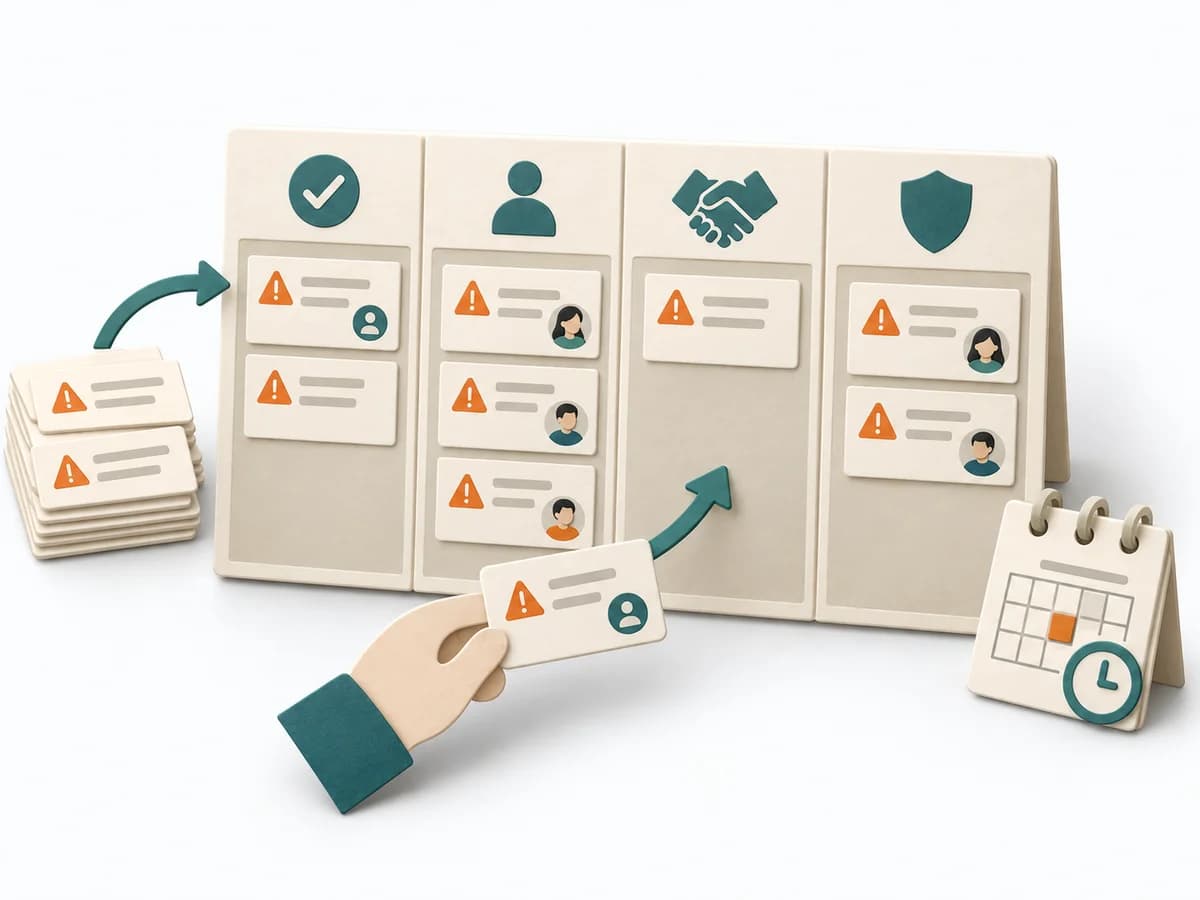
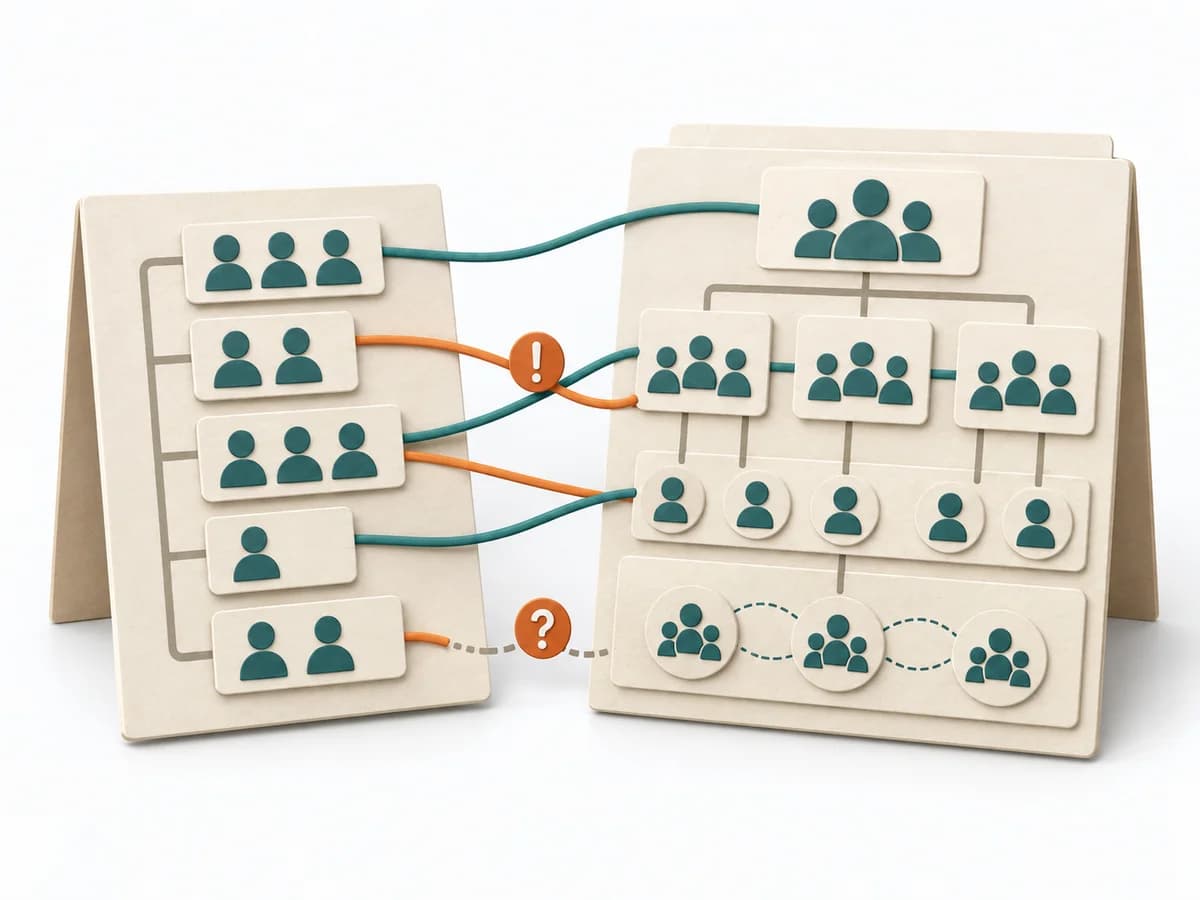
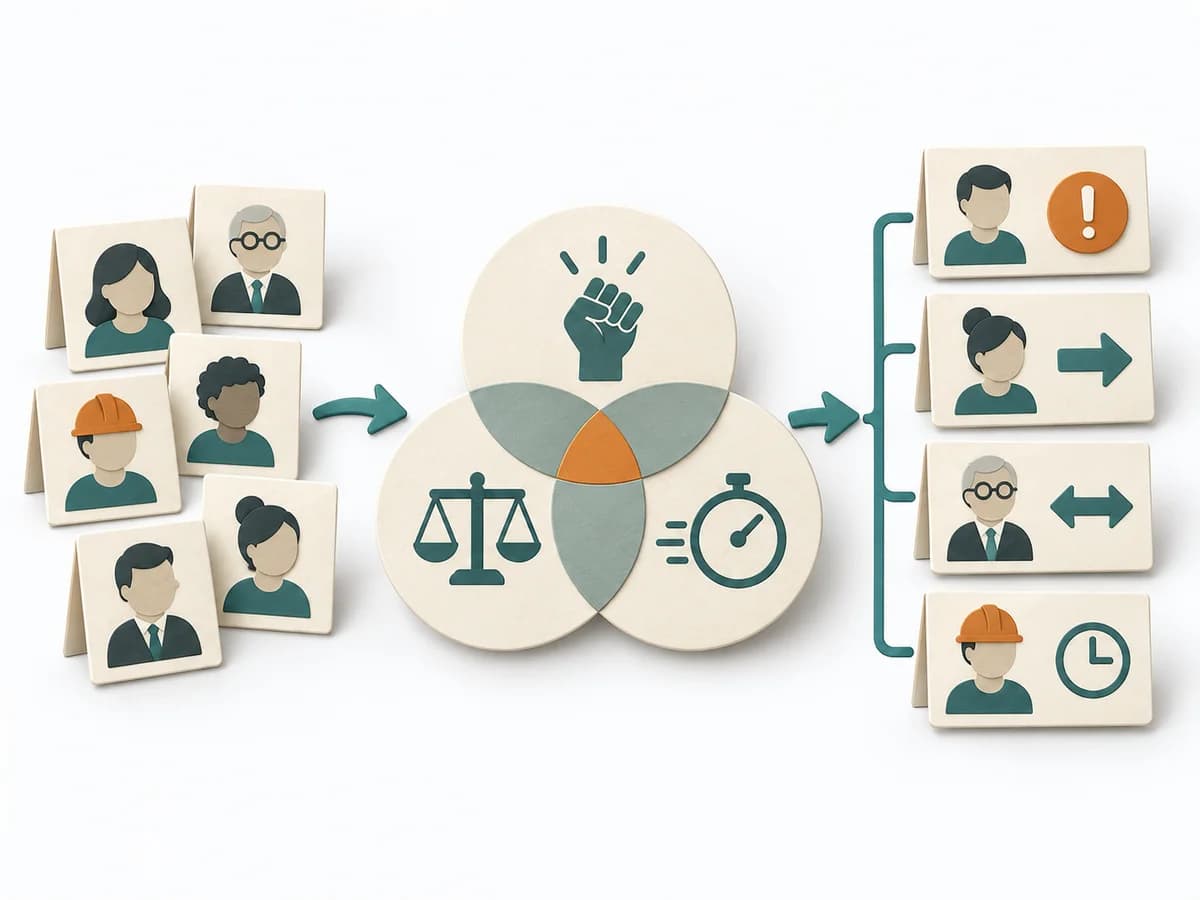
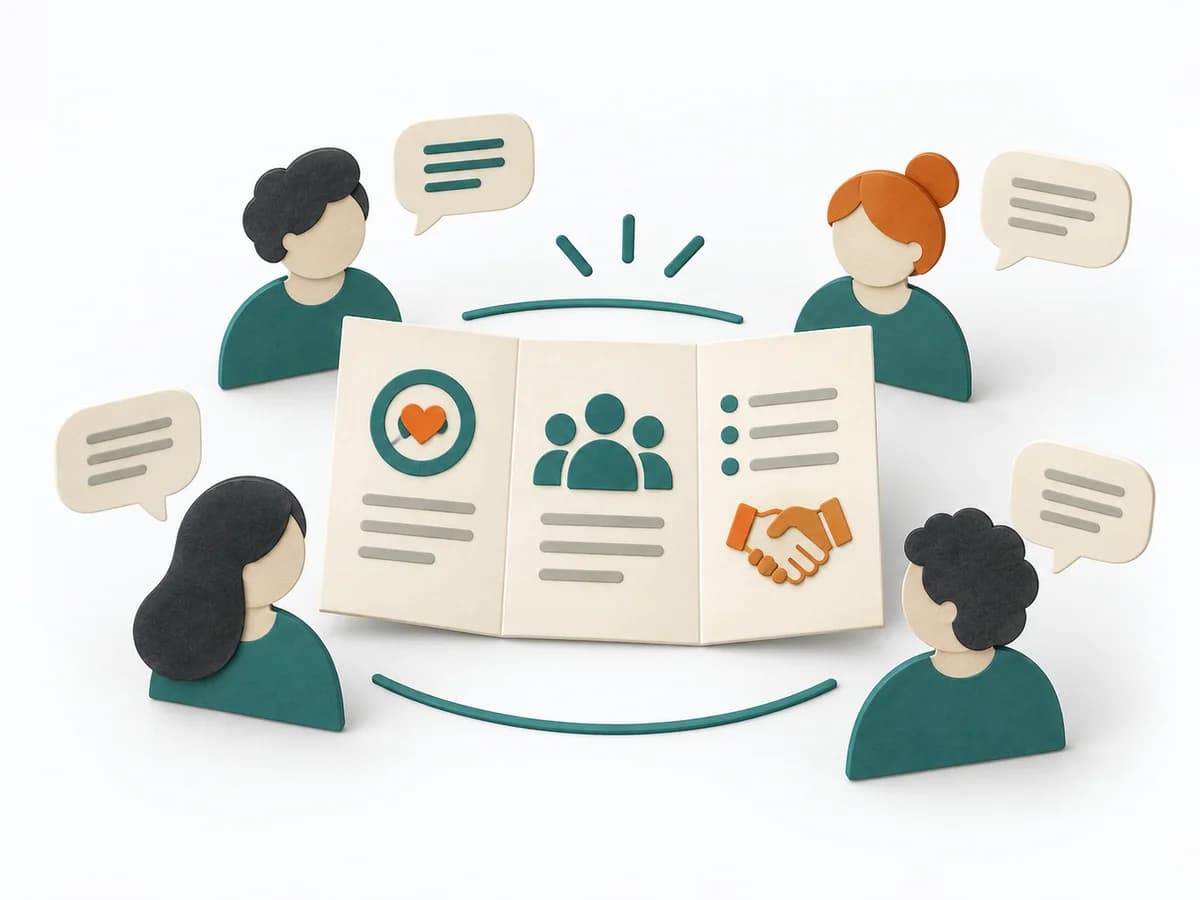
Purposedifferent | When roles, interfaces, or projects fail because of differing expectations, Expectation Mapping surfaces these differences. It shows what each side takes for granted and where the pictures diverge. | Helps clarify scope, sequence, and delivery flow in concrete terms. It makes work, boundaries, and order steerable. The result is captured as a RAID Log and a source for status reporting. | When several teams collaborate repeatedly, it describes the right interaction mode for each interface between them. It clarifies responsibility, interaction, and load between teams. The result is captured as an interaction heat map and pairwise agreements. |
Complexitydifferent | Low | Low | Medium |
Timedifferent | 45-90 min | 30 min Setup, dann laufend | Half day |
Participantsdifferent | 3-12 | 1-3 maintaining, briefing for everyone | Team-Leads plus Architecture |
Formatdifferent | Workshop | Async | Workshop |
Outputdifferent | Expectation Map, Alignment Notes, Agreements | RAID Log, Status Report Source | Interaction Heat Map, Agreements per Pair |
Tagsno overlap | AlignmentStakeholdersTeam | RiskTrackingStakeholdersGovernance | TeamAlignmentCollaborationOrganization |
Often compared together
Methods with strong topical overlap with the current selection, not yet in the comparison.