View methods side by side.
Choose up to four methods. Add them using the search and share the comparison by copying its link.
| Criterion | 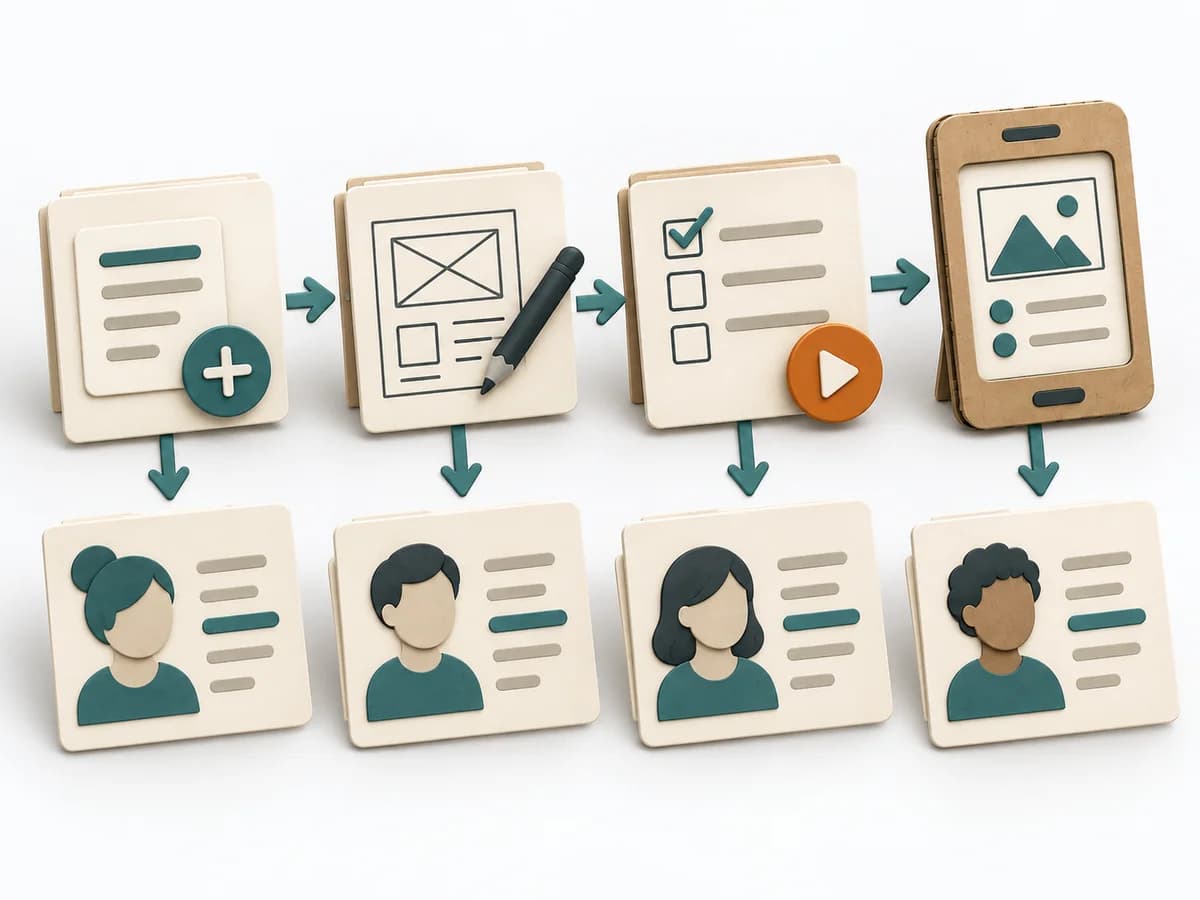 Knowledge Modeling Event Modeling | 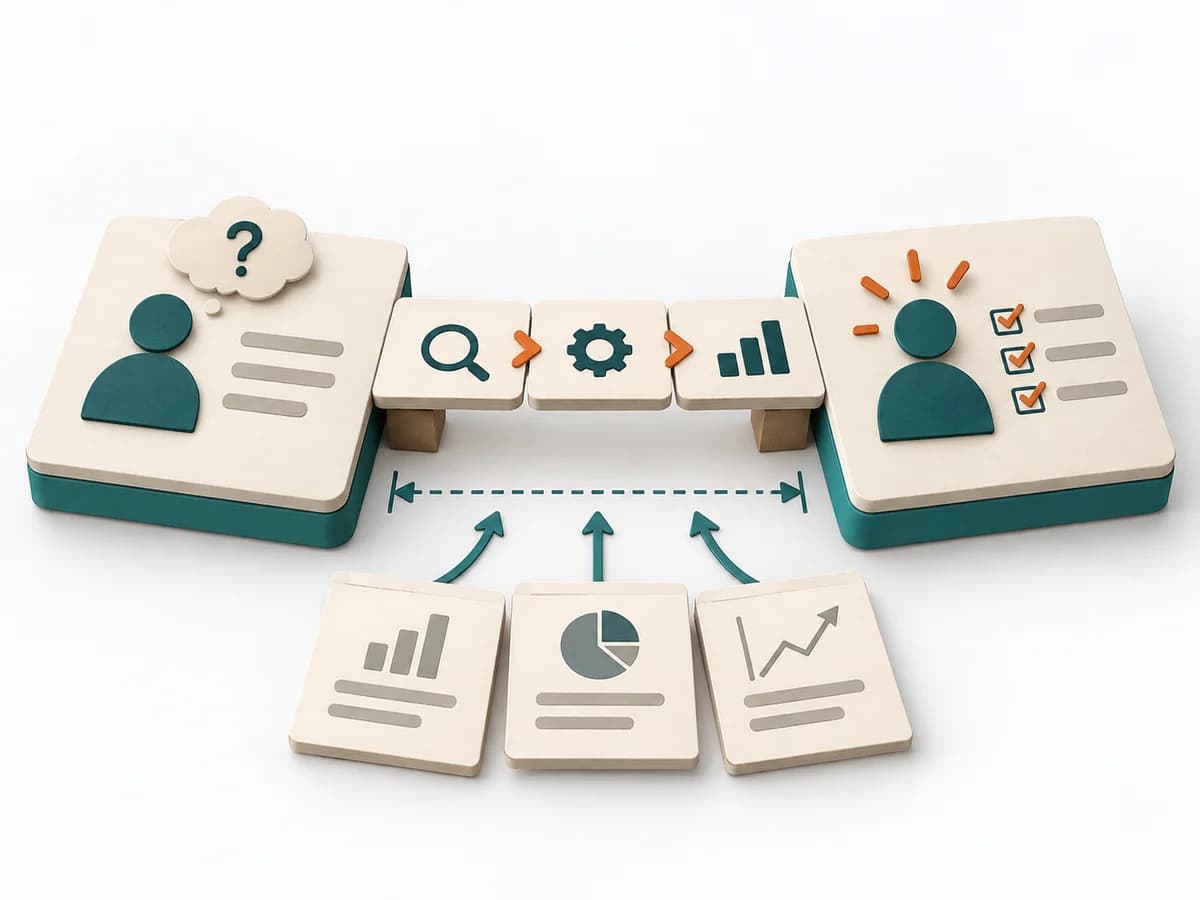 Business Strategy GAP Analysis | 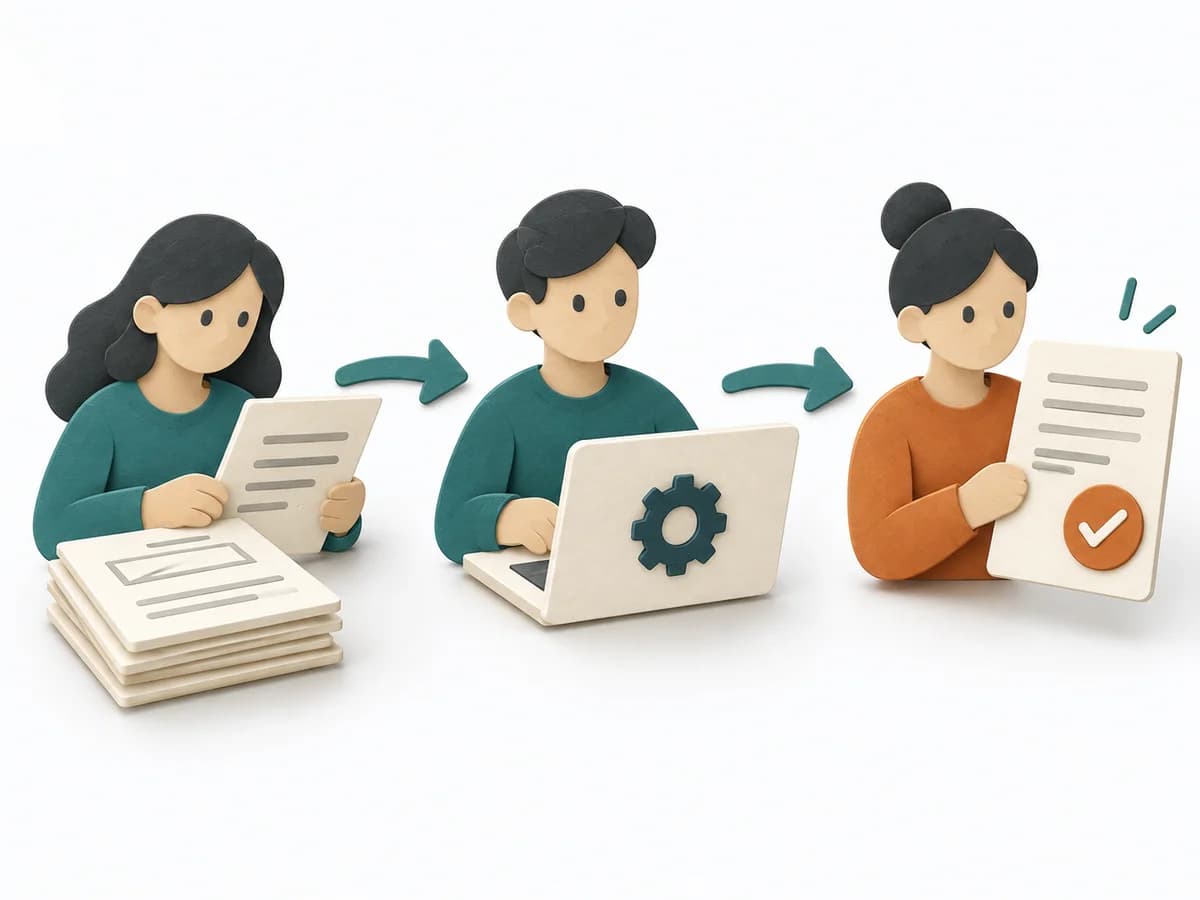 Knowledge Modeling Domain Storytelling |
|---|---|---|---|
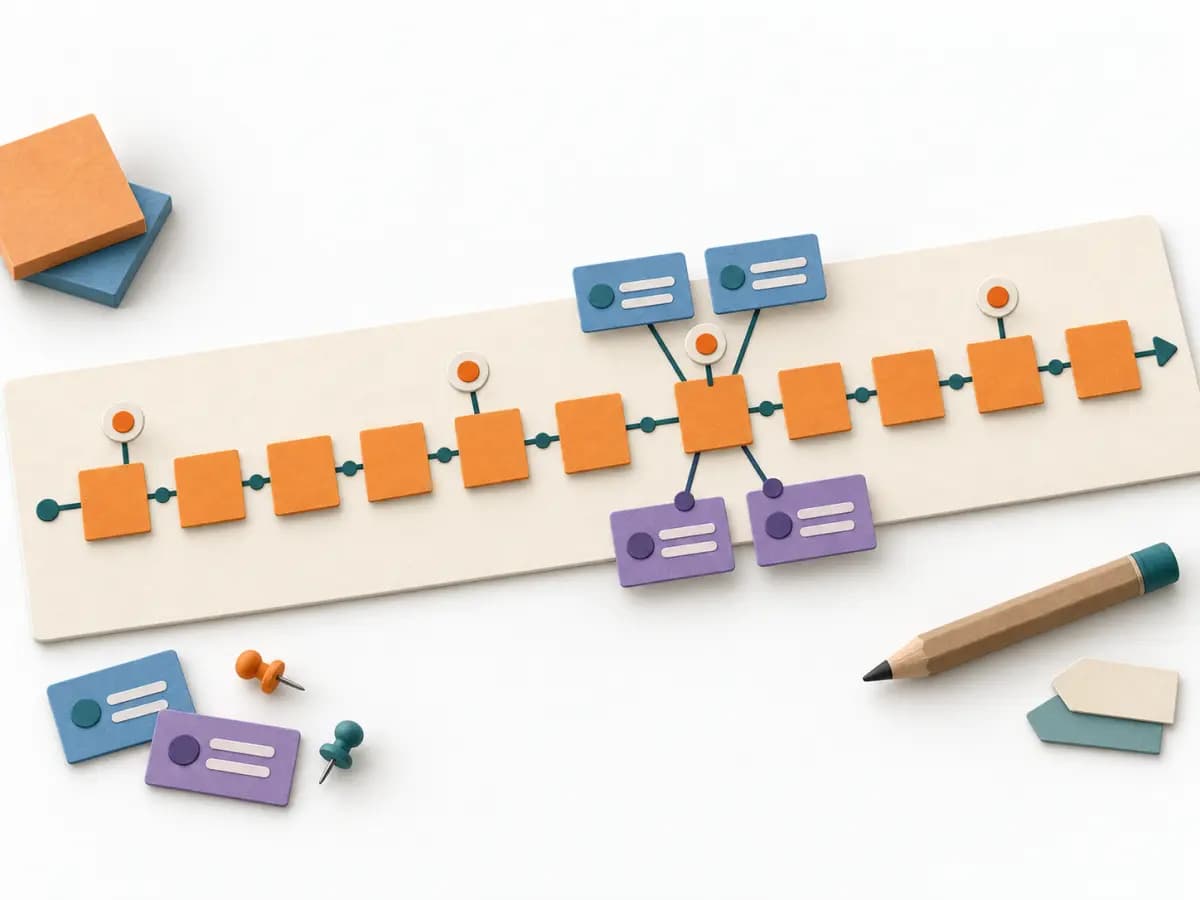
Purposedifferent | Event Modeling connects business workflows with commands, events, and views into one coherent mental model. It helps design behavior, UI, and technical slices from the same underlying logic. | GAP Analysis compares the current state with a target picture and makes the distance manageable. It becomes useful when, ahead of new initiatives, it must become clear which capabilities, processes, or resources are missing. | Domain Storytelling translates domain knowledge into a shared narrative of actors, objects, and workflows. It is especially useful when language, rules, and process understanding must be tightly connected. |
Complexitydifferent | Medium | Medium | Low |
Timedifferent | 2-6 h | 1-3 h | 1-2 h |
Participantssame | 2-8 | 2-8 | 2-8 |
Formatdifferent | Workshop + async | Workshop + async | Workshop |
Outputdifferent | Event Model, UI Flow, Commands, Read Models | Gap Matrix, Action Plan, Risk Notes | Domain Story, Glossary Notes, Process Narrative |
Tagsno overlap | EventsBlueprintDomain-Driven DesignBehavior | StrategyAnalysisPlanning | KnowledgeDomain-Driven DesignProcess |
Often compared together
Methods with strong topical overlap with the current selection, not yet in the comparison.