View methods side by side.
Choose up to four methods. Add them using the search and share the comparison by copying its link.
| Criterion | 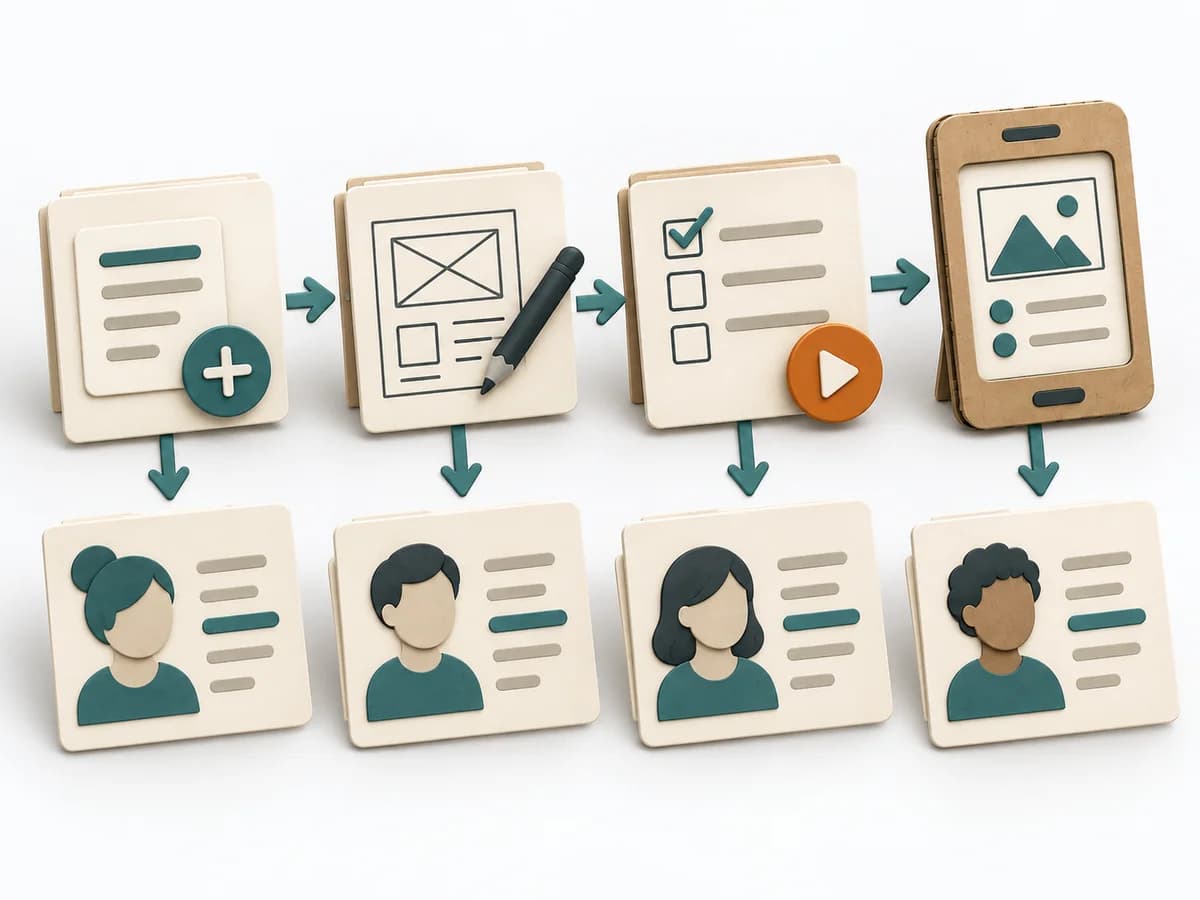 Knowledge Modeling Event Modeling |  UX Design Customer Journey Canvas |  Operations ABC Analysis |
|---|---|---|---|
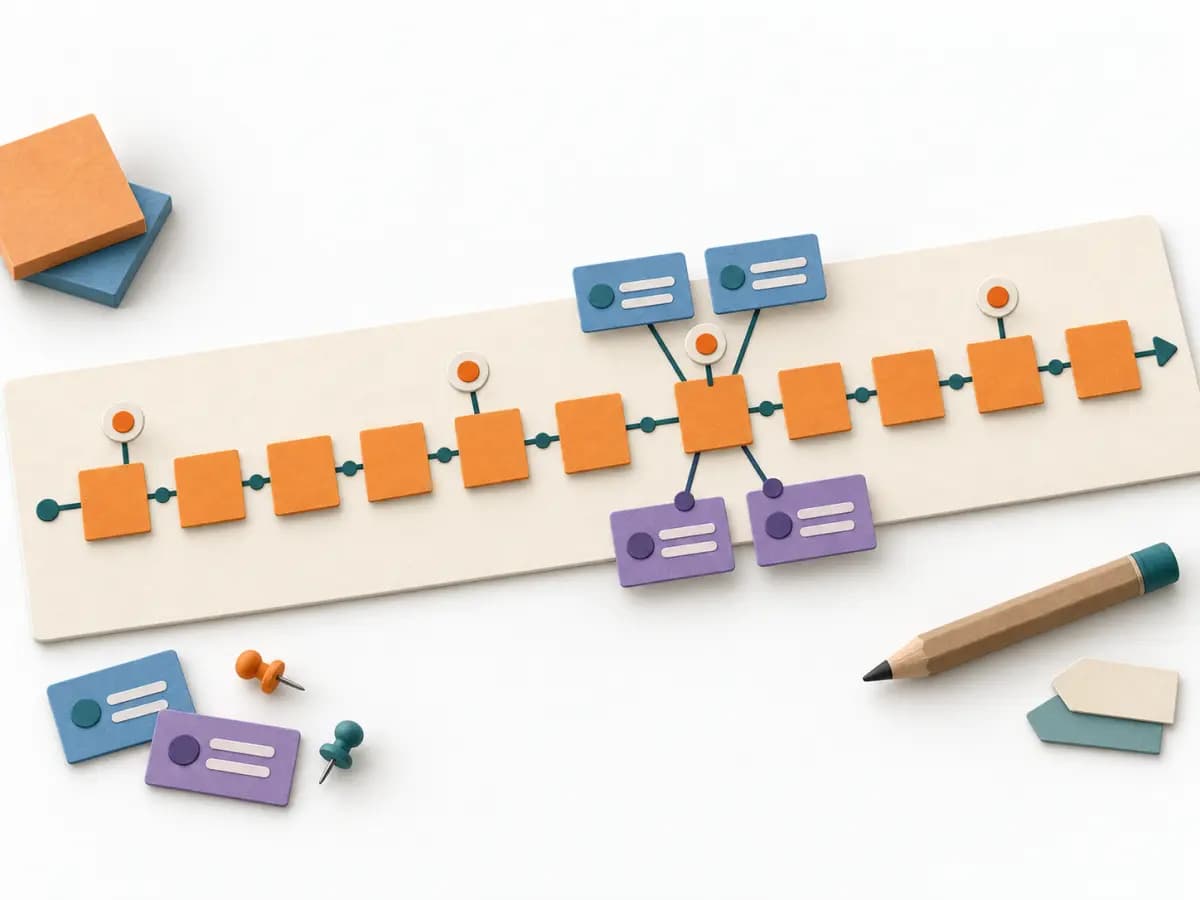
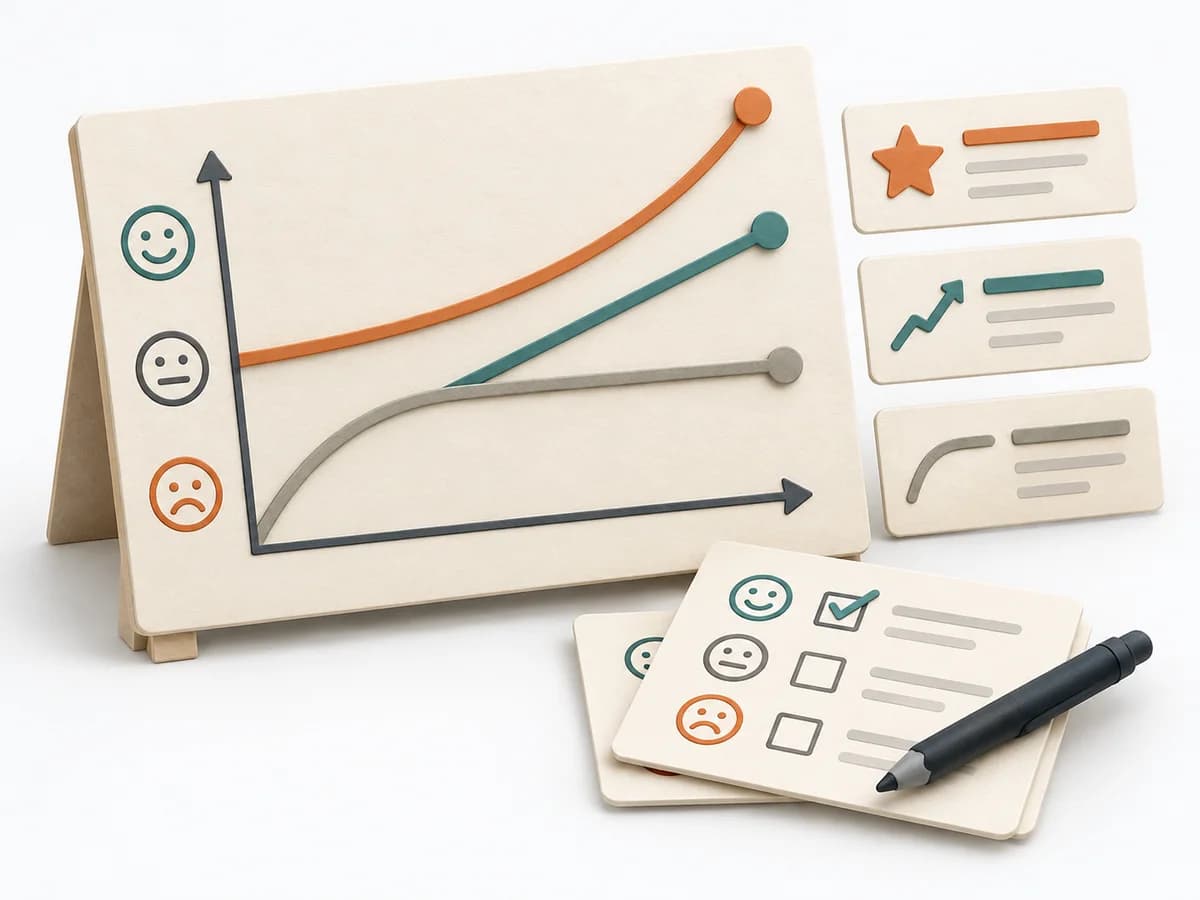
Purposedifferent | Event Modeling connects business workflows with commands, events, and views into one coherent mental model. It helps design behavior, UI, and technical slices from the same underlying logic. | When a journey needs to be understood across several phases, it arranges experience, touchpoints, and opportunities into one picture. It makes gaps and friction along the user path clear. | With many similar objects of differing economic significance, the method prioritizes effort by effect. It separates what needs regular steering from what rarely needs attention. |
Complexitydifferent | Medium | Medium | Low |
Timedifferent | 2-6 h | 1-3 h | 30-60 min |
Participantsdifferent | 2-8 | 3-10 | 1-5 |
Formatdifferent | Workshop + async | Workshop | Async |
Outputdifferent | Event Model, UI Flow, Commands, Read Models | Customer Journey Canvas, Pain Points, Experience Opportunities | ABC Classification, Focus Rules, Control List |
Tagsno overlap | EventsBlueprintDomain-Driven DesignBehavior | JourneyCustomerService designCanvas | PrioritizationOperationsPortfolio |
Often compared together
Methods with strong topical overlap with the current selection, not yet in the comparison.