View methods side by side.
Choose up to four methods. Add them using the search and share the comparison by copying its link.
| Criterion |  Operations Causal Factor Analysis |  UX Design Service Blueprinting | 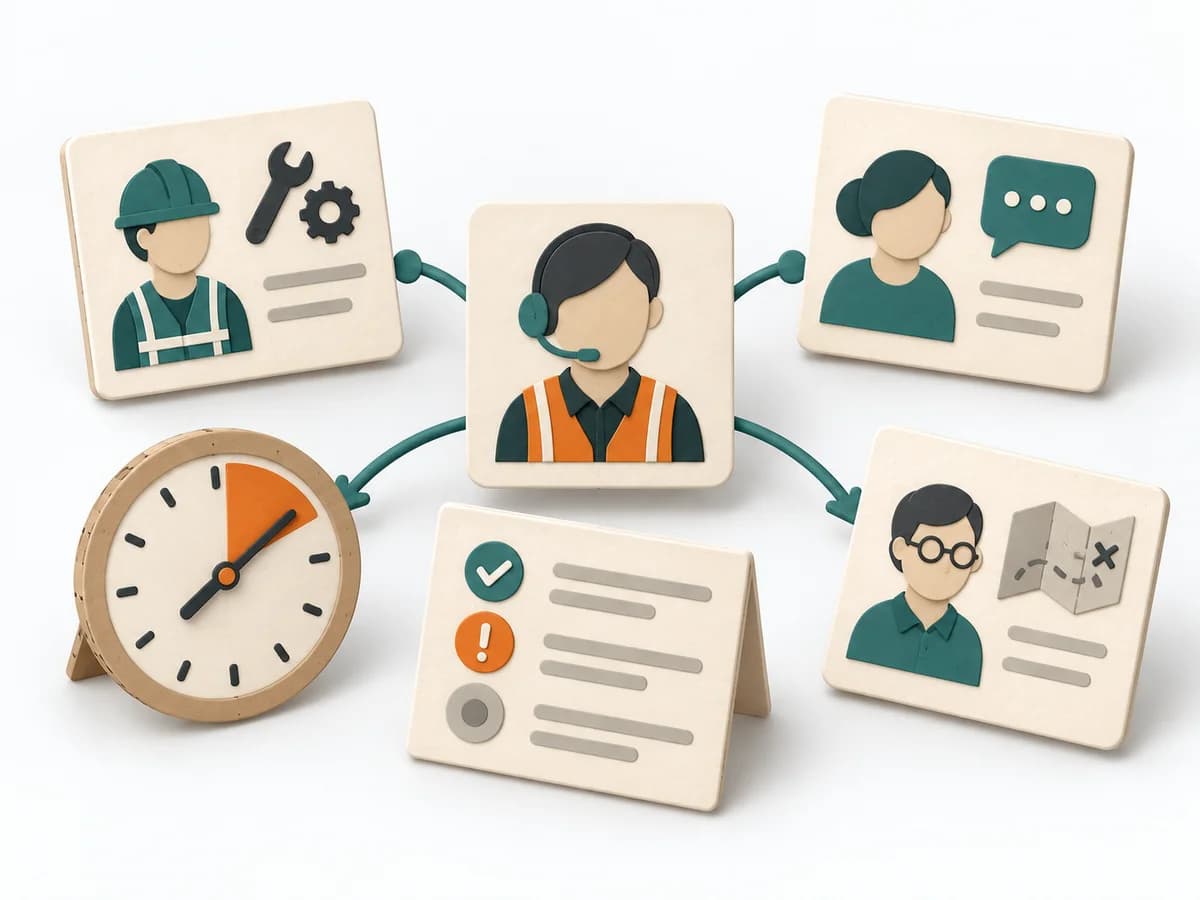 DevOps Incident Command |
|---|---|---|---|
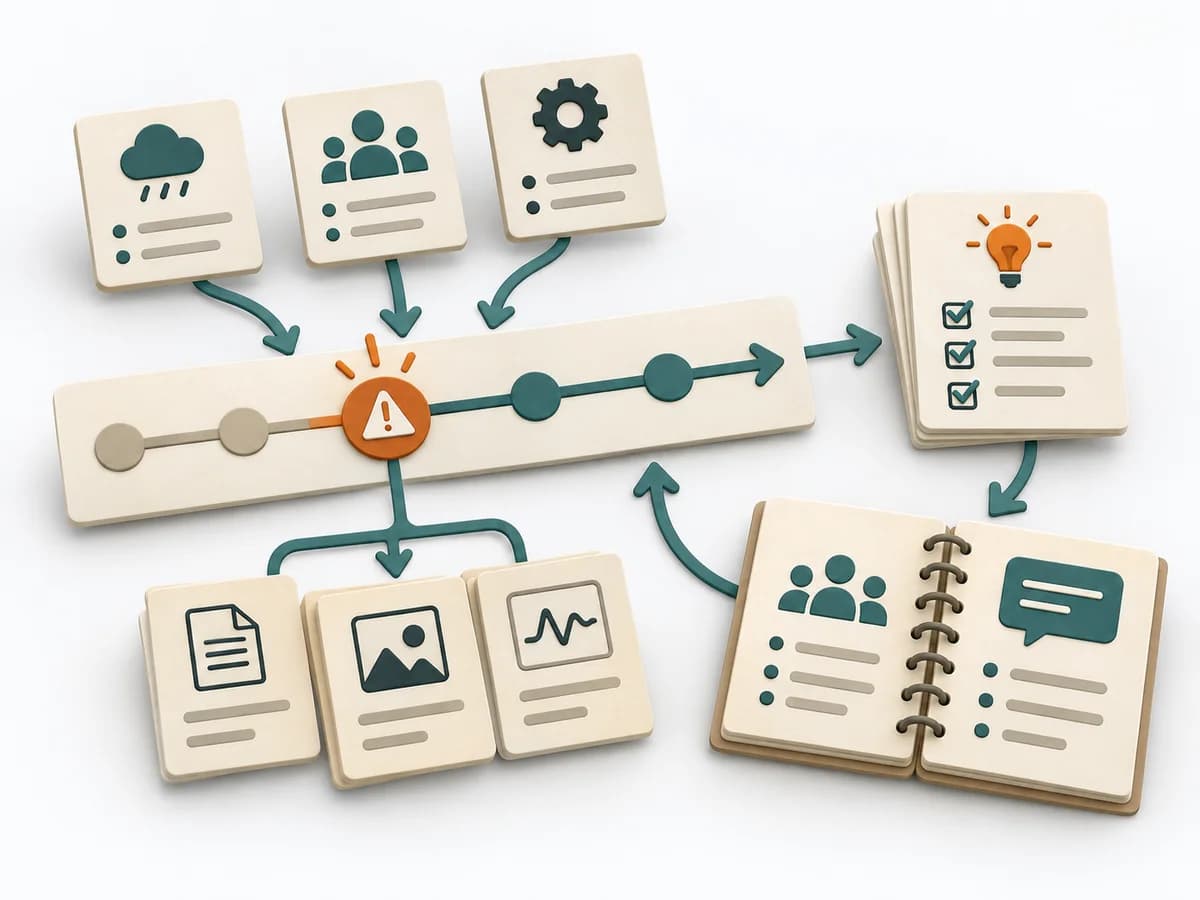
Purposedifferent | For an event with a complicated course, the method breaks down the contributing factors along the timeline. It shows how conditions, decisions, and reactions together produce a course of events. | When a service experience is spread across several touchpoints, it brings frontstage and backstage together. It shows where user contact and internal responsibility must fit. | During an acute incident with several people involved, the method creates a clear leadership and communication structure. It reduces chaos when fast coordination and clean situational awareness are both needed at once. |
Complexitydifferent | High | High | Medium |
Timedifferent | 2-6 h | 0.5-2 Tage | As needed |
Participantsdifferent | 3-10 | 6-12 | 4-15 |
Formatdifferent | Workshop + async | Workshop | Workshop + async |
Outputdifferent | Event Timeline, Causal Factor Chart, Cause List, Corrective Actions | Service Blueprint, Fail Points, Ownership Map | Incident Log, Action Tracker, Stakeholder Updates |
Tagsno overlap | CausalityIncidentRoot causeTimeline | Service designOperationsJourneyBlueprint | IncidentOperationsReliability |
Often compared together
Methods with strong topical overlap with the current selection, not yet in the comparison.