View methods side by side.
Choose up to four methods. Add them using the search and share the comparison by copying its link.
| Criterion |  Operations Causal Factor Analysis |  Facilitation Expectation Mapping |  Operations Barrier Analysis |
|---|---|---|---|
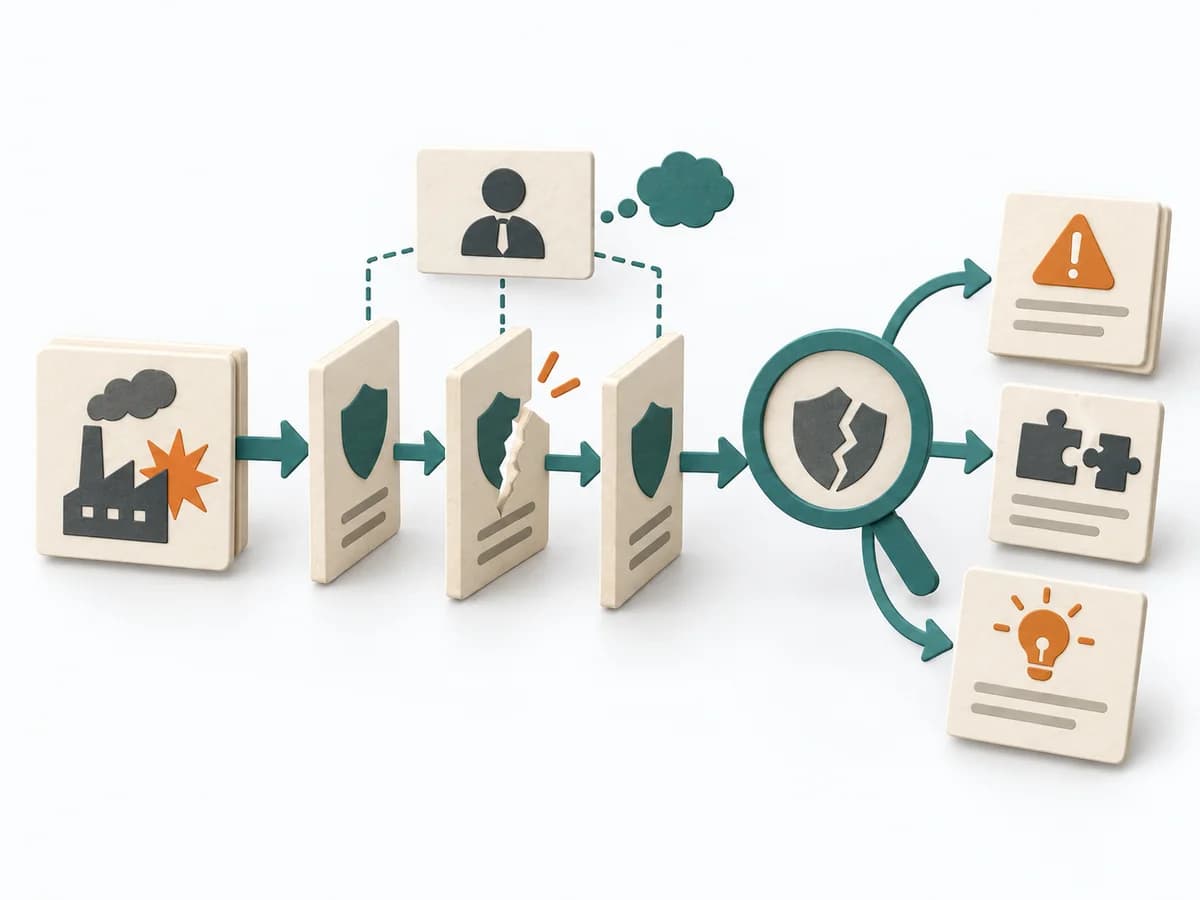
Purposedifferent | For an event with a complicated course, the method breaks down the contributing factors along the timeline. It shows how conditions, decisions, and reactions together produce a course of events. | When roles, interfaces, or projects fail because of differing expectations, Expectation Mapping surfaces these differences. It shows what each side takes for granted and where the pictures diverge. | For a risk that can only be managed through multiple layers of protection, the method examines the effectiveness of each barrier. It shows where safeguards are missing, too weak, or fail under real conditions. |
Complexitydifferent | High | Low | Medium |
Timedifferent | 2-6 h | 45-90 min | 2-4 h |
Participantsdifferent | 3-10 | 3-12 | 2-6 |
Formatdifferent | Workshop + async | Workshop | Workshop + async |
Outputdifferent | Event Timeline, Causal Factor Chart, Cause List, Corrective Actions | Expectation Map, Alignment Notes, Agreements | Barrier Inventory, Failure Analysis per Barrier, Action Backlog |
Tagsno overlap | CausalityIncidentRoot causeTimeline | AlignmentStakeholdersTeam | Root causeSafetyIncident |
Often compared together
Methods with strong topical overlap with the current selection, not yet in the comparison.