View methods side by side.
Choose up to four methods. Add them using the search and share the comparison by copying its link.
| Criterion |  Systems Thinking Behavior Over Time Graph | 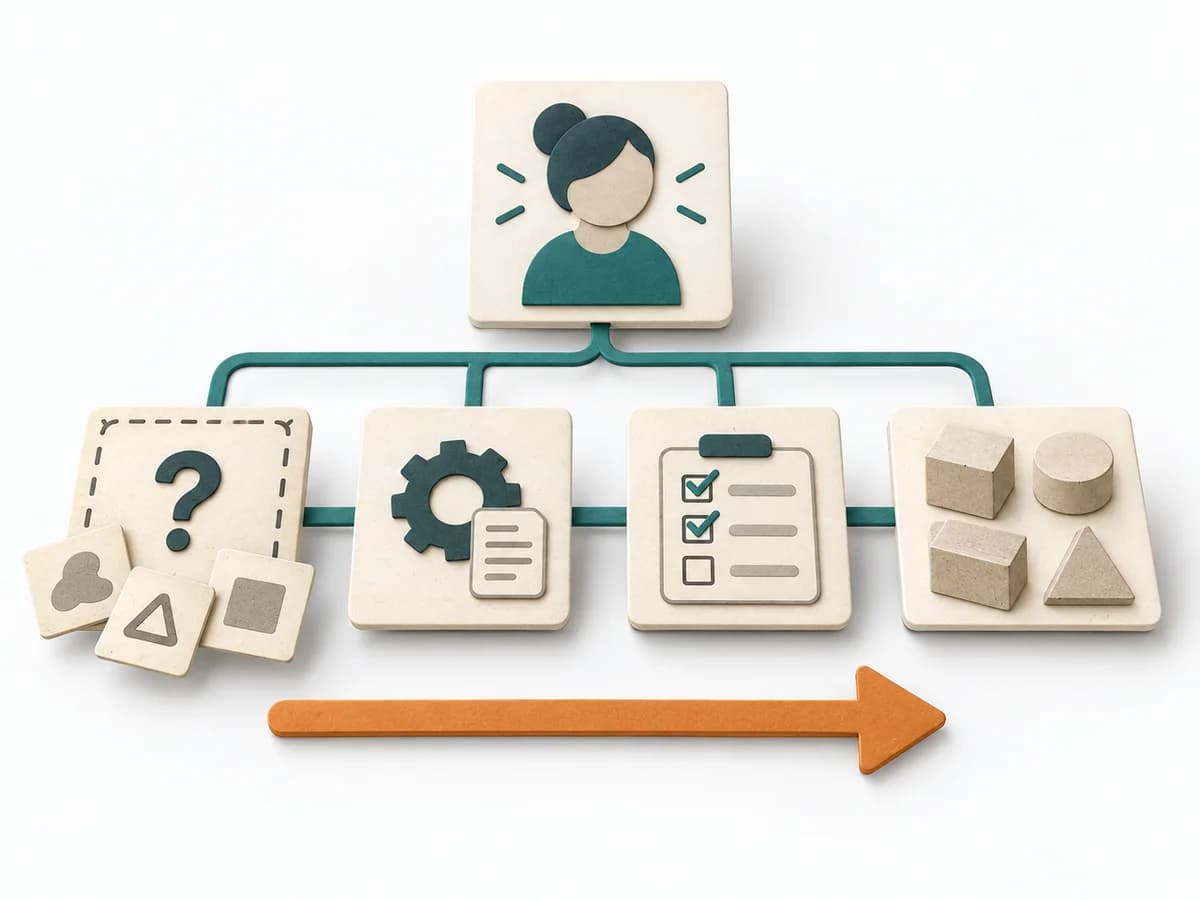 Systems Thinking Wardley Mapping |  Facilitation Stakeholder Mapping |
|---|---|---|---|
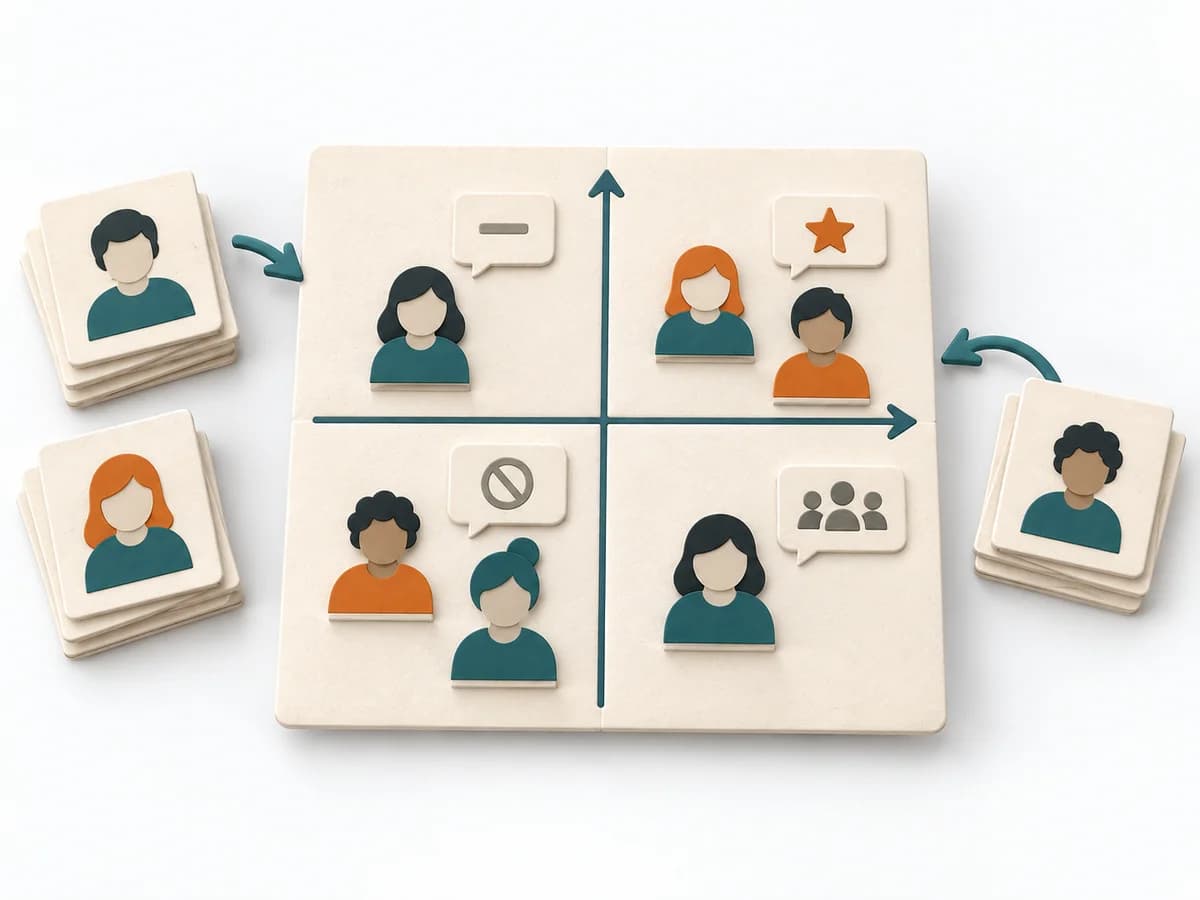
Purposedifferent | A Behavior Over Time Graph shows how a metric or observation develops over time. The method makes trends, breaks, and recurring patterns visible that get lost in snapshots. | Wardley Mapping makes visible where an offering stands today and where it can evolve. The method connects user need, value chain, and evolution stages into a strategic basis for platform, build, or buy decisions. | When an initiative depends on many people, interests, and power dynamics, Stakeholder Mapping systematically orders the environment. It shows who influences, who is affected, and where relationship management or safeguarding matters first. |
Complexitydifferent | Low | Medium | Low |
Timedifferent | 20-45 min | 1-3 h | 60–90 min |
Participantsdifferent | 1-10 | 2-10 | 2-8 |
Formatsame | Workshop + async | Workshop + async | Workshop + async |
Outputdifferent | Behavior Over Time Graph, Trend Hypotheses, Key Events | Wardley Map, Strategic Options, Evolution Notes | Stakeholder Map, Engagement Plan, Risk Notes |
Tagsno overlap | Systems thinkingPatternsDynamics | StrategySystems thinkingDynamics | StakeholdersAlignmentFacilitationChange |
Often compared together
Methods with strong topical overlap with the current selection, not yet in the comparison.