View methods side by side.
Choose up to four methods. Add them using the search and share the comparison by copying its link.
| Criterion | 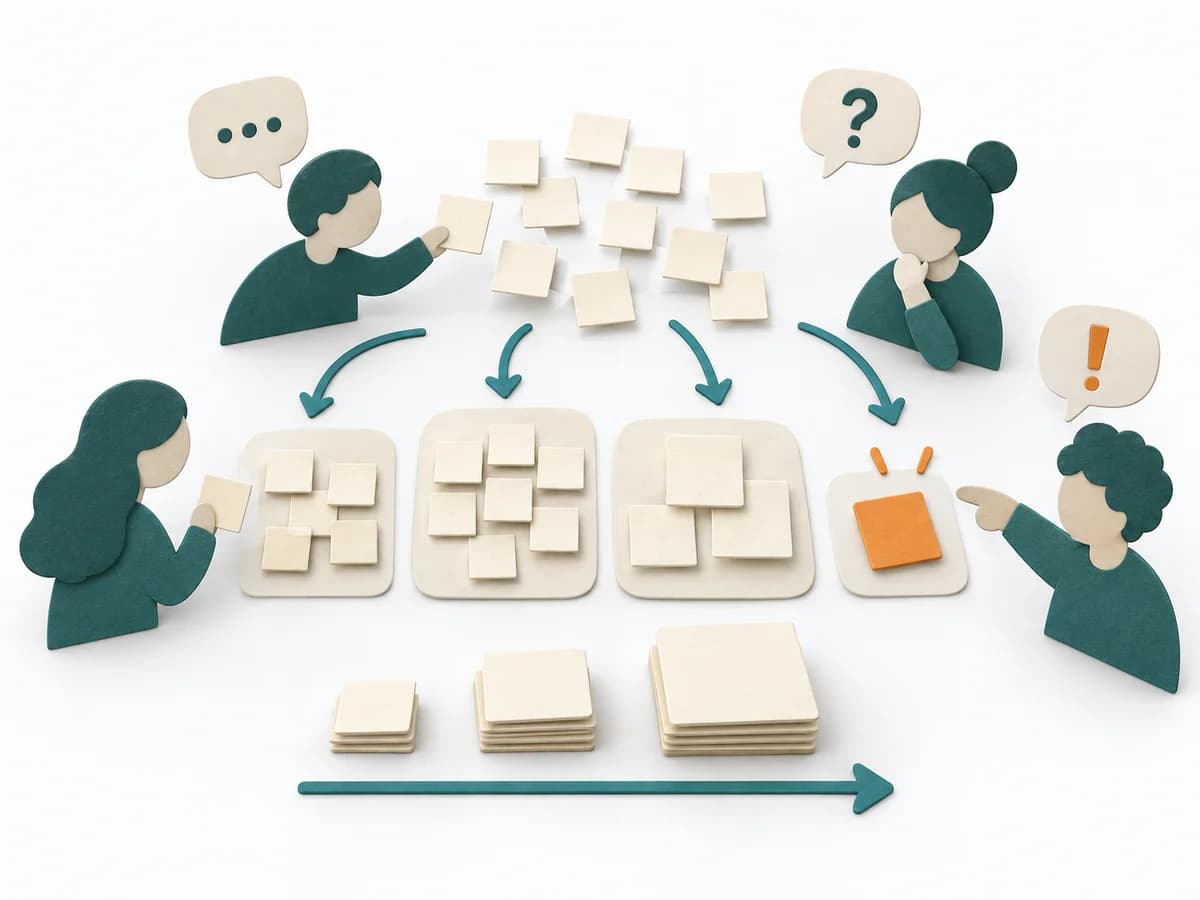 Agile Affinity Estimation | 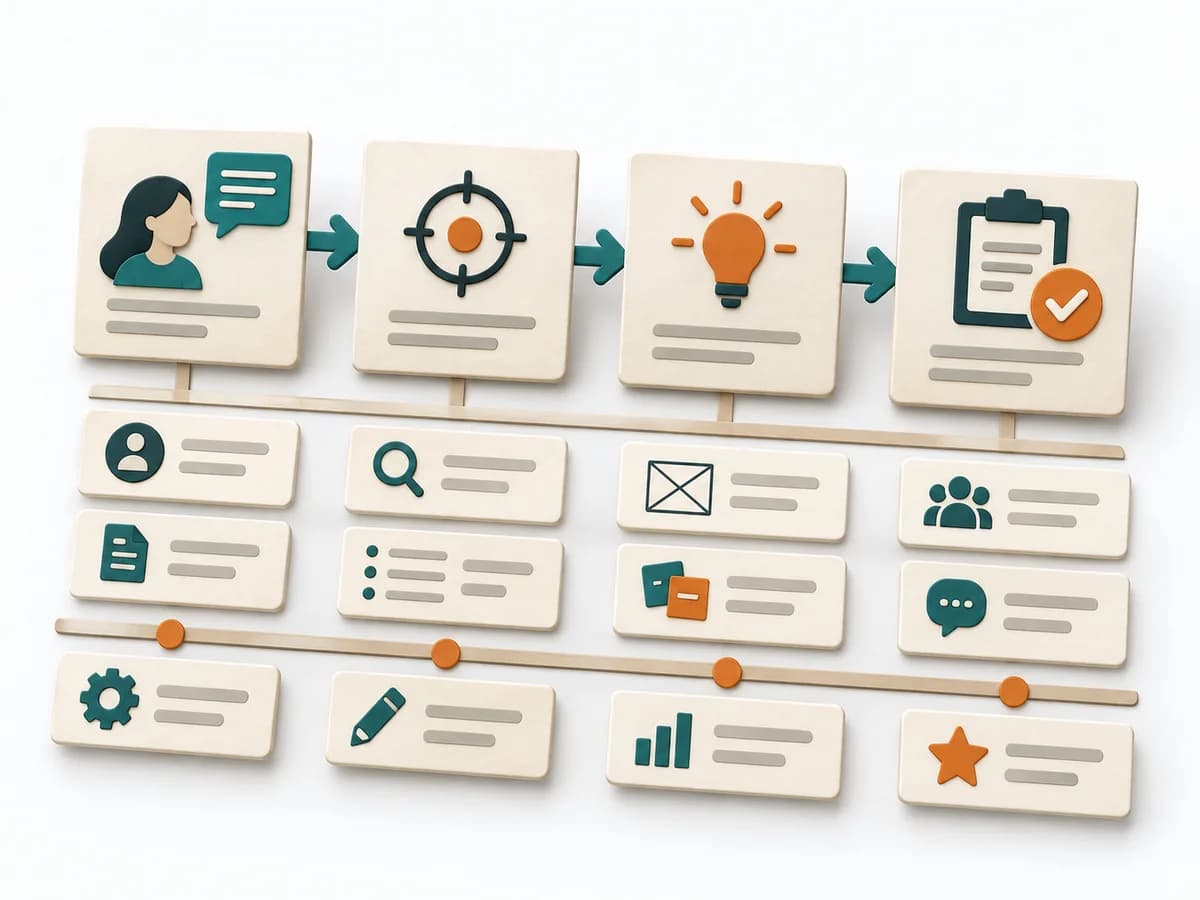 Product Discovery User Story Mapping |  UX Design Service Blueprinting |
|---|---|---|---|
Purposedifferent | When many tasks need to be classified quickly, it sorts them by perceived effort and similarity. It reduces the effort of fine-grained estimation for large volumes. | When user goals and delivery scope could drift apart, it orders the journey from goal to slice. It makes visible where an MVP can genuinely be cut. | When a service experience is spread across several touchpoints, it brings frontstage and backstage together. It shows where user contact and internal responsibility must fit. |
Complexitydifferent | Medium | Medium | High |
Timedifferent | 30-90 min | 2-4 h | 0.5-2 Tage |
Participantsdifferent | 3-12 | 4-10 | 6-12 |
Formatsame | Workshop | Workshop | Workshop |
Outputdifferent | Affinity Size Map, Grouped Estimates, Unclear Items | Story Map, Release Slices, Backlog Candidates | Service Blueprint, Fail Points, Ownership Map |
Tagsno overlap | EstimationBacklogRelative sizing | BacklogJourneyPlanningMVP | Service designOperationsJourneyBlueprint |
Often compared together
Methods with strong topical overlap with the current selection, not yet in the comparison.