View methods side by side.
Choose up to four methods. Add them using the search and share the comparison by copying its link.
| Criterion | 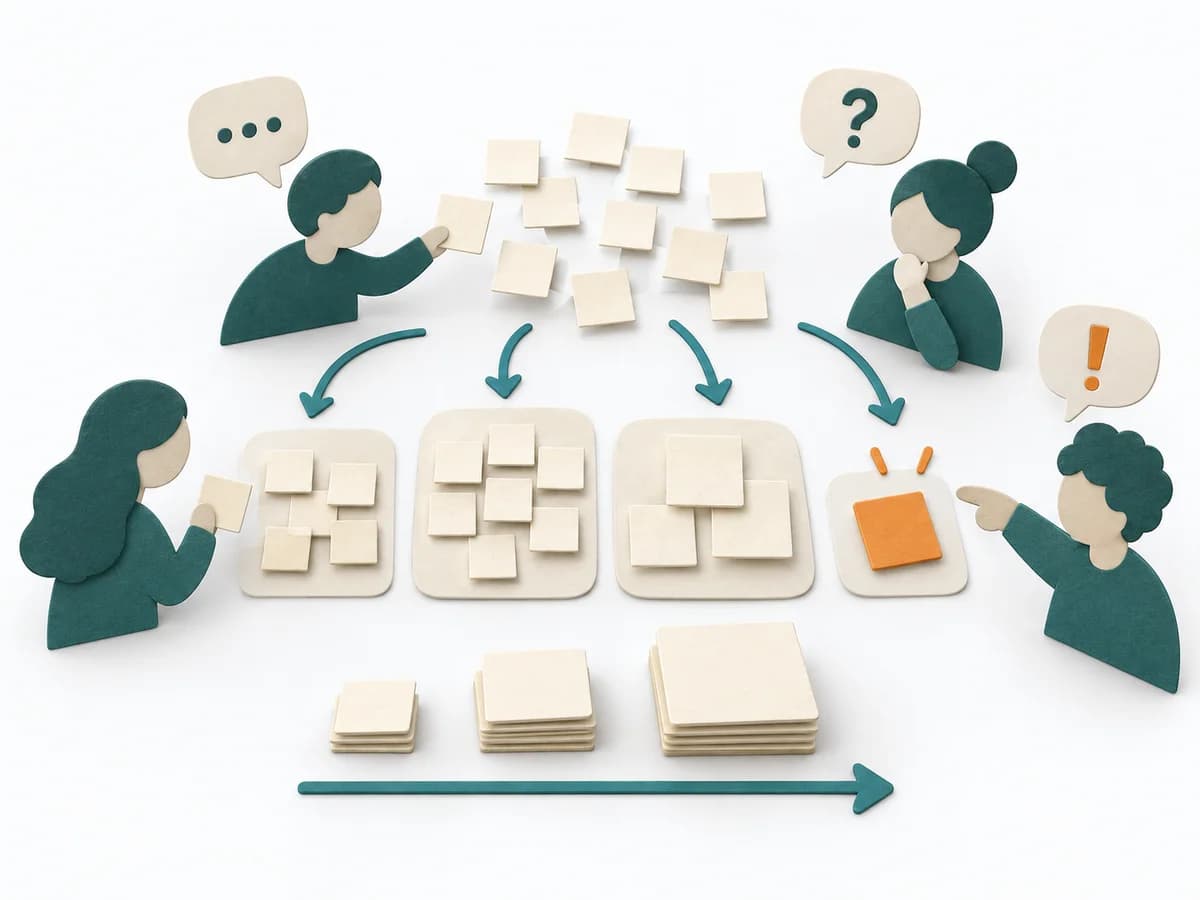 Agile Affinity Estimation |  Systems Thinking Systems Mapping |  Decision Making OODA Loop |
|---|---|---|---|
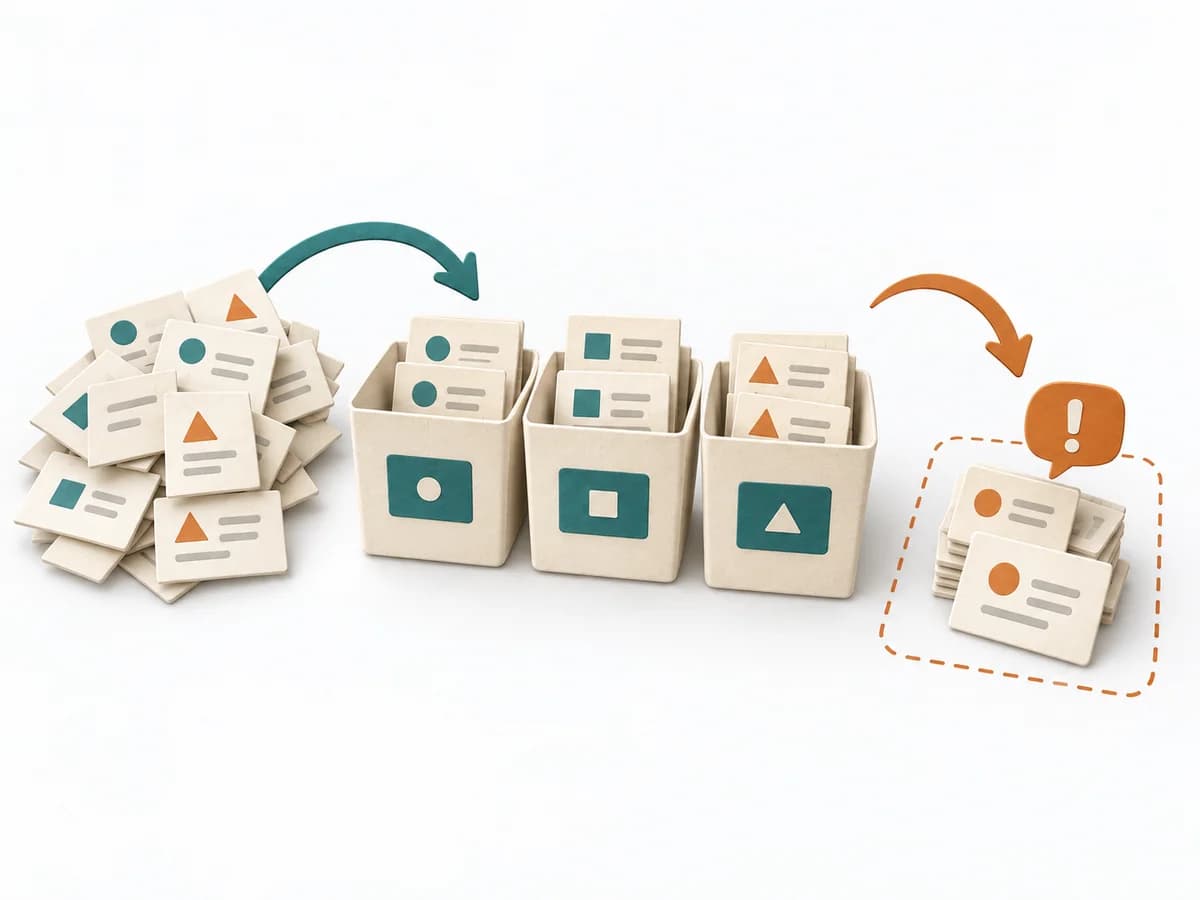
Purposedifferent | When many tasks need to be classified quickly, it sorts them by perceived effort and similarity. It reduces the effort of fine-grained estimation for large volumes. | Systems Mapping arranges elements, relationships, and boundaries so a complex field becomes legible at a glance. The overview stabilizes the overall picture before detail work or steering begins. | In dynamic situations, decisions become outdated faster than they can be prepared. The OODA Loop holds observing, orienting, deciding, and acting together as a recurring rhythm so reaction does not slide into inertia. |
Complexitysame | Medium | Medium | Medium |
Timedifferent | 30-90 min | 1-3 h | 15-60 min je Zyklus |
Participantsdifferent | 3-12 | 3-12 | 1-8 |
Formatdifferent | Workshop | Workshop + async | Workshop + async |
Outputdifferent | Affinity Size Map, Grouped Estimates, Unclear Items | System Map, Dependencies, Leverage Points | Situation Assessment, Decision Loop, Action Updates |
Tagsno overlap | EstimationBacklogRelative sizing | Systems thinkingMappingBoundariesChange | DecisionChangeLearningStrategy |
Often compared together
Methods with strong topical overlap with the current selection, not yet in the comparison.