View methods side by side.
Choose up to four methods. Add them using the search and share the comparison by copying its link.
| Criterion | 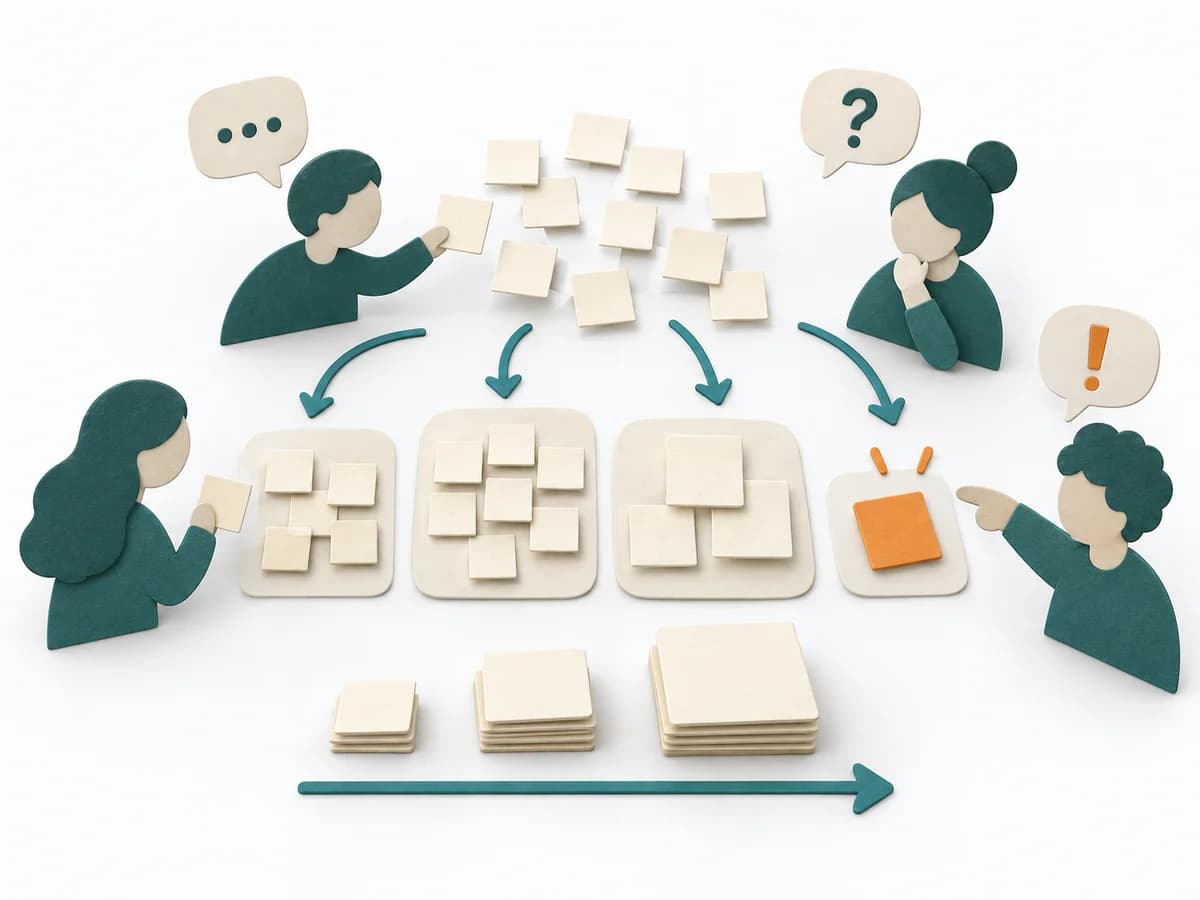 Agile Affinity Estimation |  UX Design Service Blueprinting | 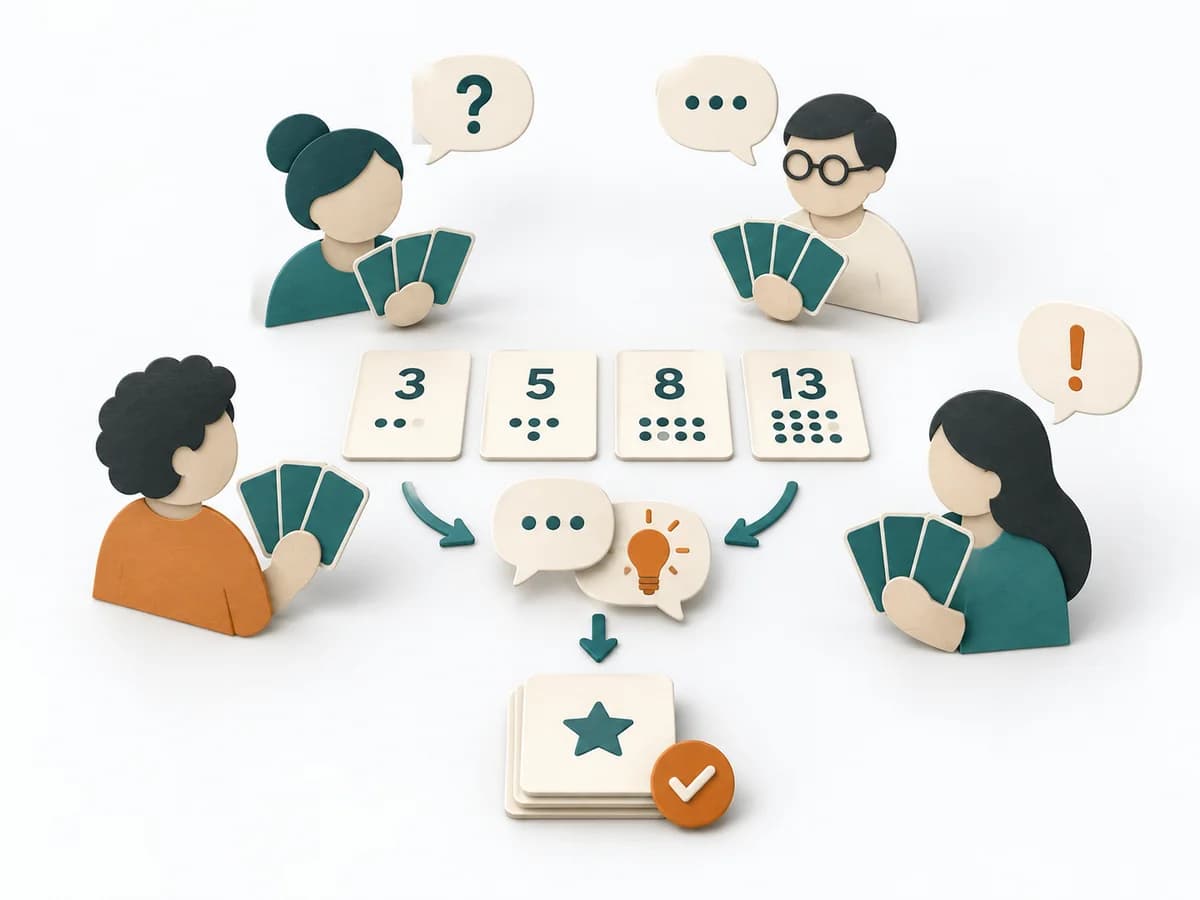 Agile Planning Poker |
|---|---|---|---|
Purposedifferent | When many tasks need to be classified quickly, it sorts them by perceived effort and similarity. It reduces the effort of fine-grained estimation for large volumes. | When a service experience is spread across several touchpoints, it brings frontstage and backstage together. It shows where user contact and internal responsibility must fit. | When estimates within the team diverge too much, it puts differing expectations on a common test bench. It separates rough complexity from unspoken assumptions. |
Complexitydifferent | Medium | High | Low |
Timedifferent | 30-90 min | 0.5-2 Tage | 2-5 min je Item |
Participantsdifferent | 3-12 | 6-12 | 3-9 |
Formatdifferent | Workshop | Workshop | Workshop + async |
Outputdifferent | Affinity Size Map, Grouped Estimates, Unclear Items | Service Blueprint, Fail Points, Ownership Map | Relative Estimates, Assumption Notes, Split Candidates |
Tagsno overlap | EstimationBacklogRelative sizing | Service designOperationsJourneyBlueprint | EstimationAgileRelative sizingTeam |
Often compared together
Methods with strong topical overlap with the current selection, not yet in the comparison.