View methods side by side.
Choose up to four methods. Add them using the search and share the comparison by copying its link.
| Criterion | 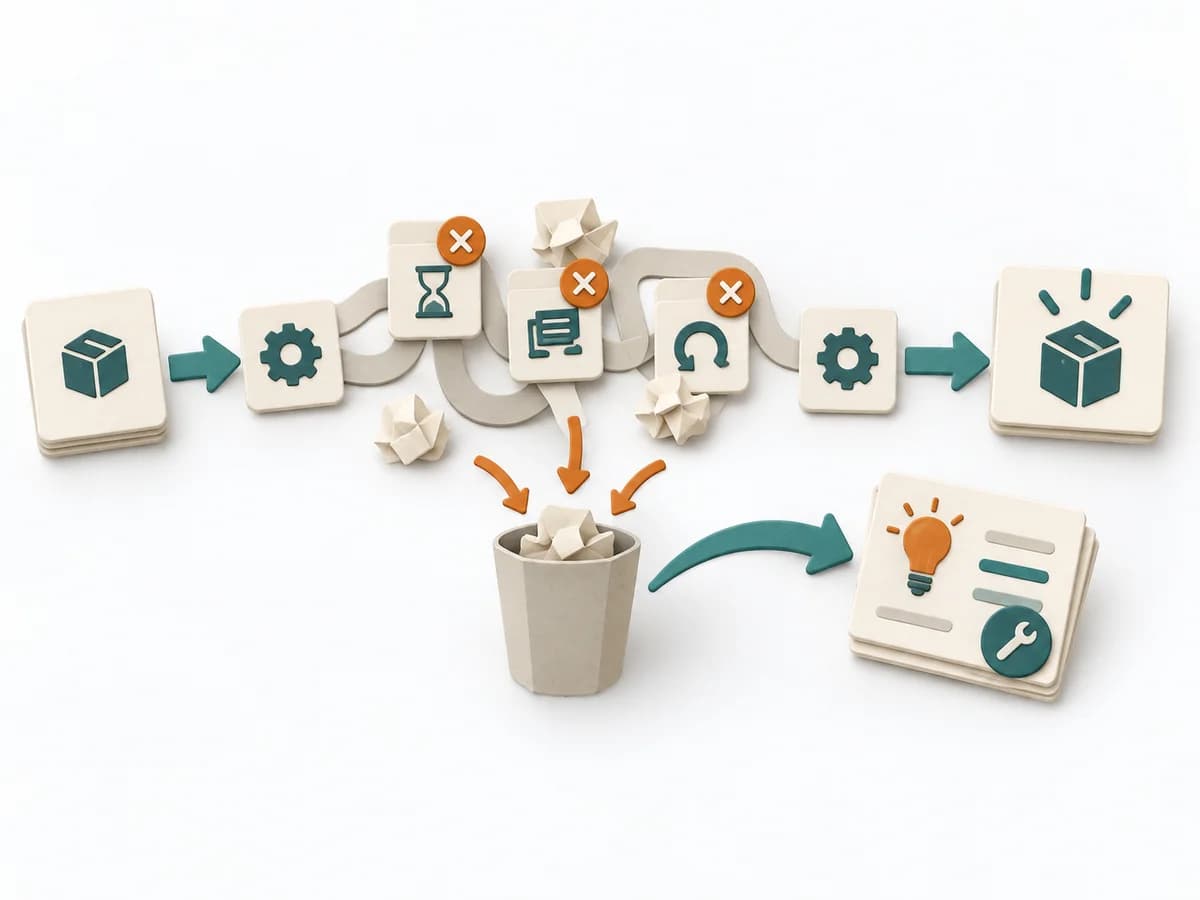 Operations Waste Analysis |  Delivery Value Stream Mapping |  Operations Root Cause Analysis |
|---|---|---|---|
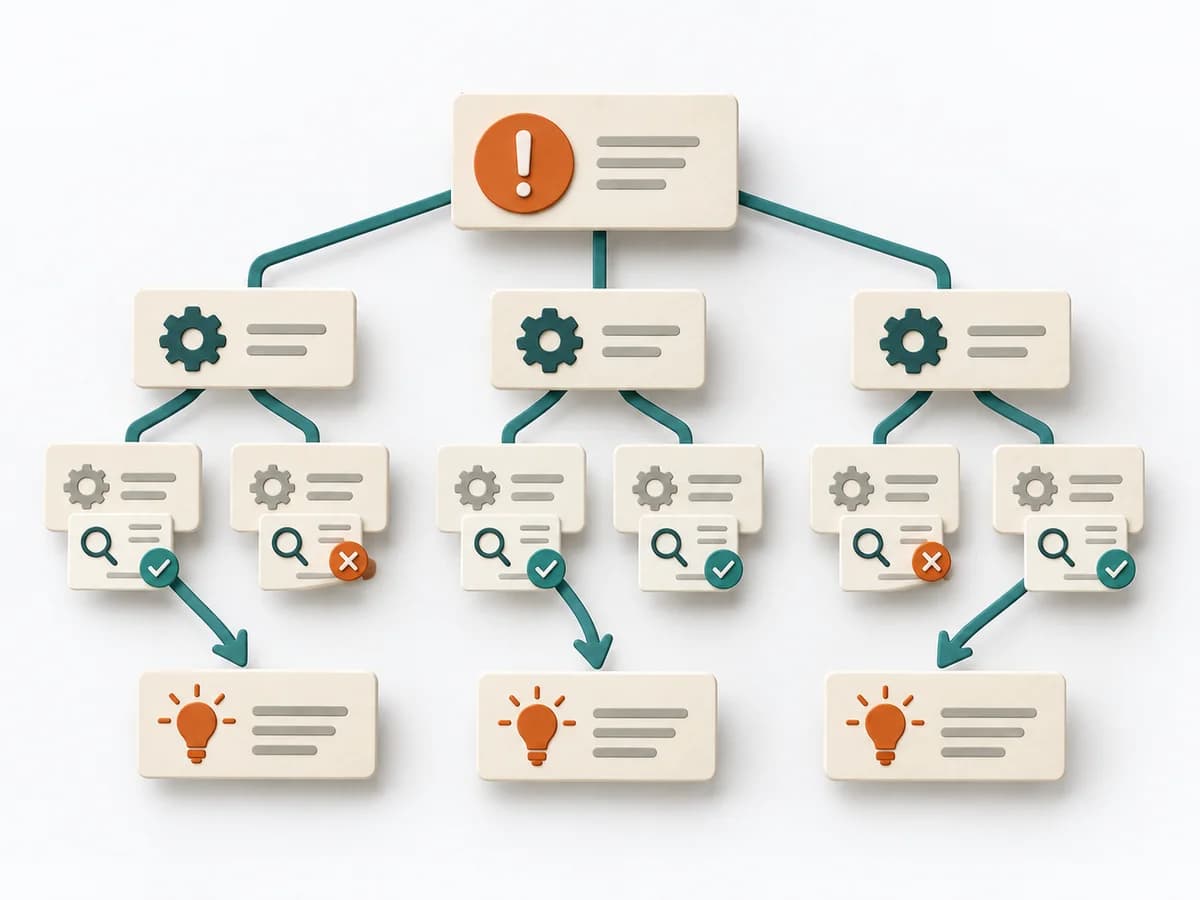
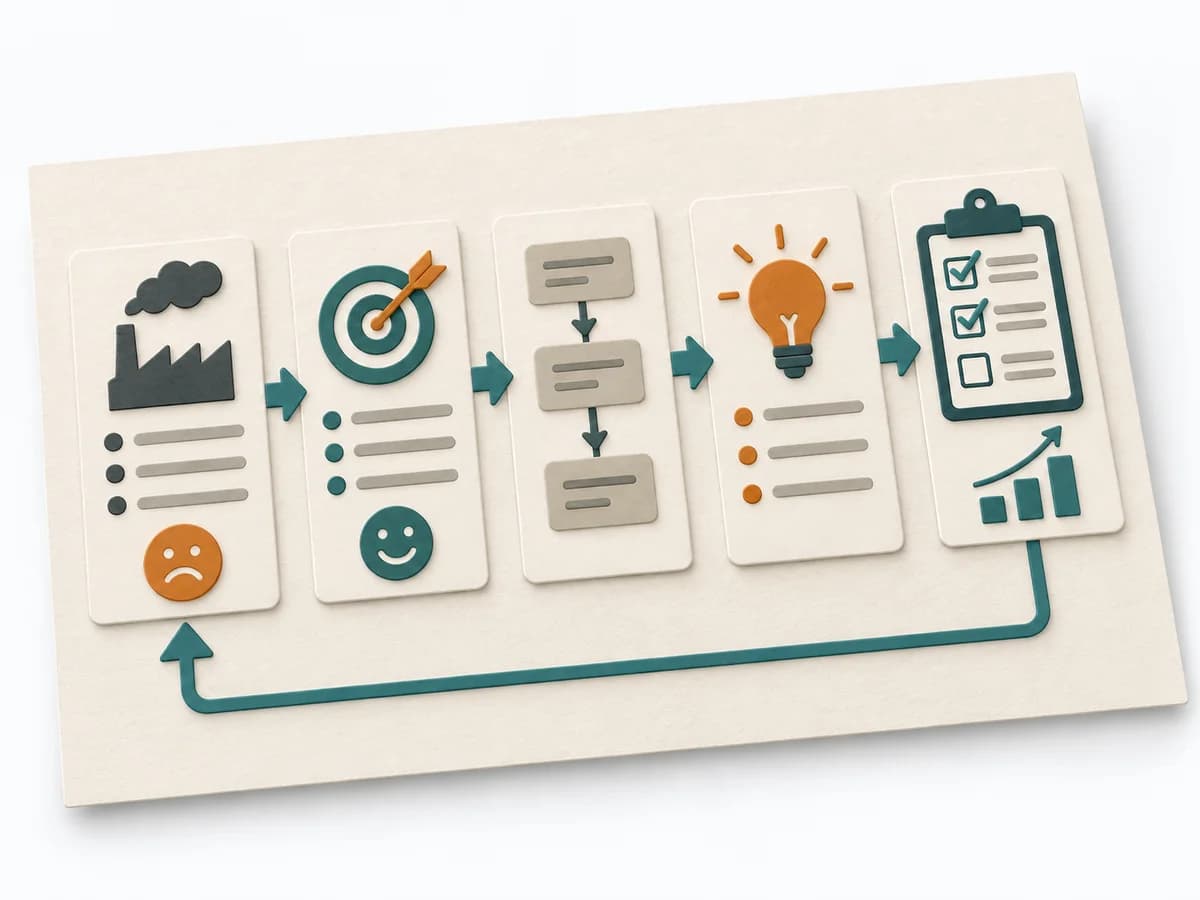
Purposedifferent | For a process that keeps people busy but creates little value, the method exposes waste. It directs attention to unnecessary movement, waiting times, rework, and overdelivery. | When delivery work dissolves into wait times, handoffs, and hidden effort, Value Stream Mapping makes the actual flow visible. The method exposes bottlenecks, idle time, and feedback loops so lead time and improvement levers become tangible. | When a problem keeps recurring and the cause stays unclear, the method exposes the underlying mechanism. It separates symptom, guess, and robust explanation from one another. |
Complexitydifferent | Low | Medium | Medium |
Timedifferent | 45-120 min | 1-3 h | 1-4 h |
Participantsdifferent | 2-8 | 4-10 | 3-8 |
Formatdifferent | Workshop | Workshop | Workshop + async |
Outputdifferent | Waste Map, Prioritized Waste, Improvement Backlog | Current-state map, Future-state map, Bottleneck list | Problem Statement, Cause Hypotheses, Confirmed Causes, Action Plan |
Tagsno overlap | WasteLeanProcess improvement | LeanFlowWasteDelivery | Root causeProblem solvingQualityIncident |
Often compared together
Methods with strong topical overlap with the current selection, not yet in the comparison.