View methods side by side.
Choose up to four methods. Add them using the search and share the comparison by copying its link.
| Criterion | 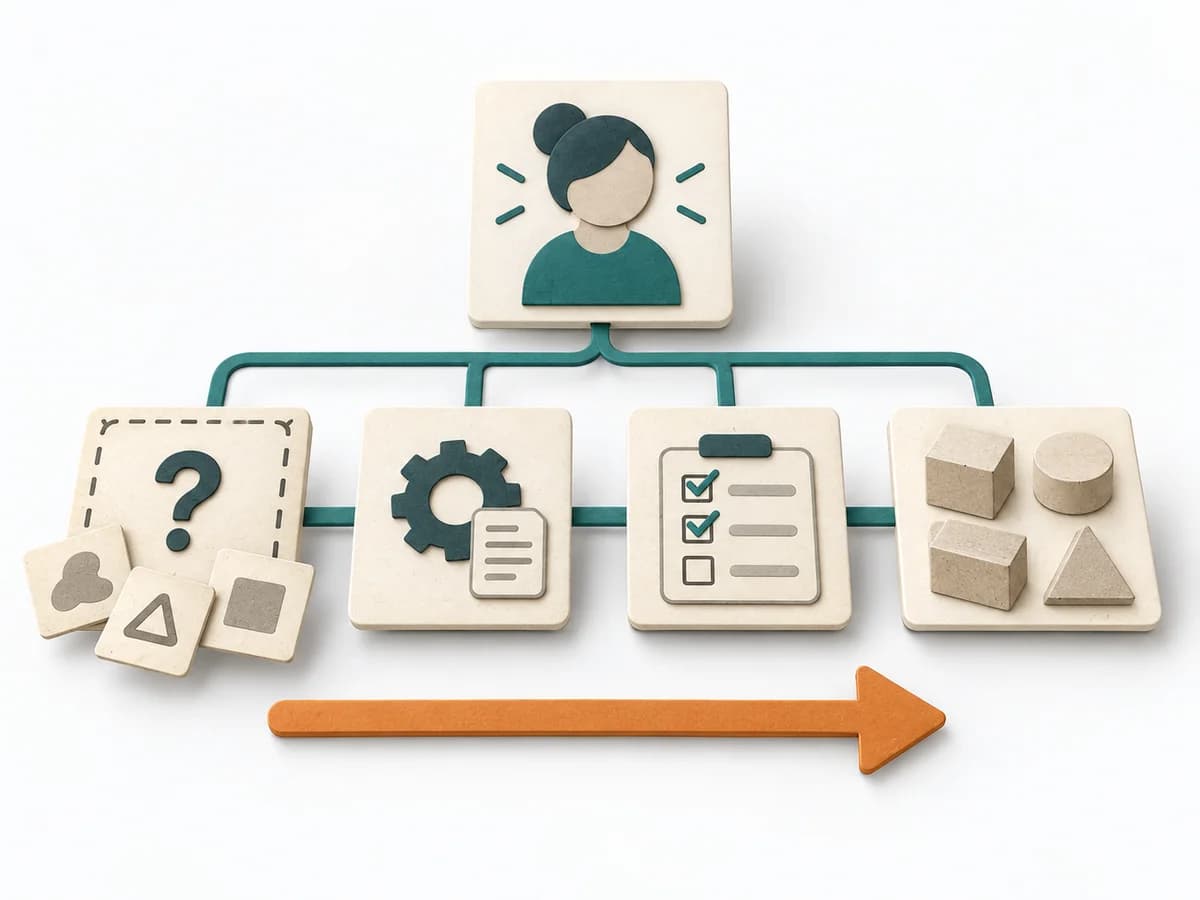 Systems Thinking Wardley Mapping | 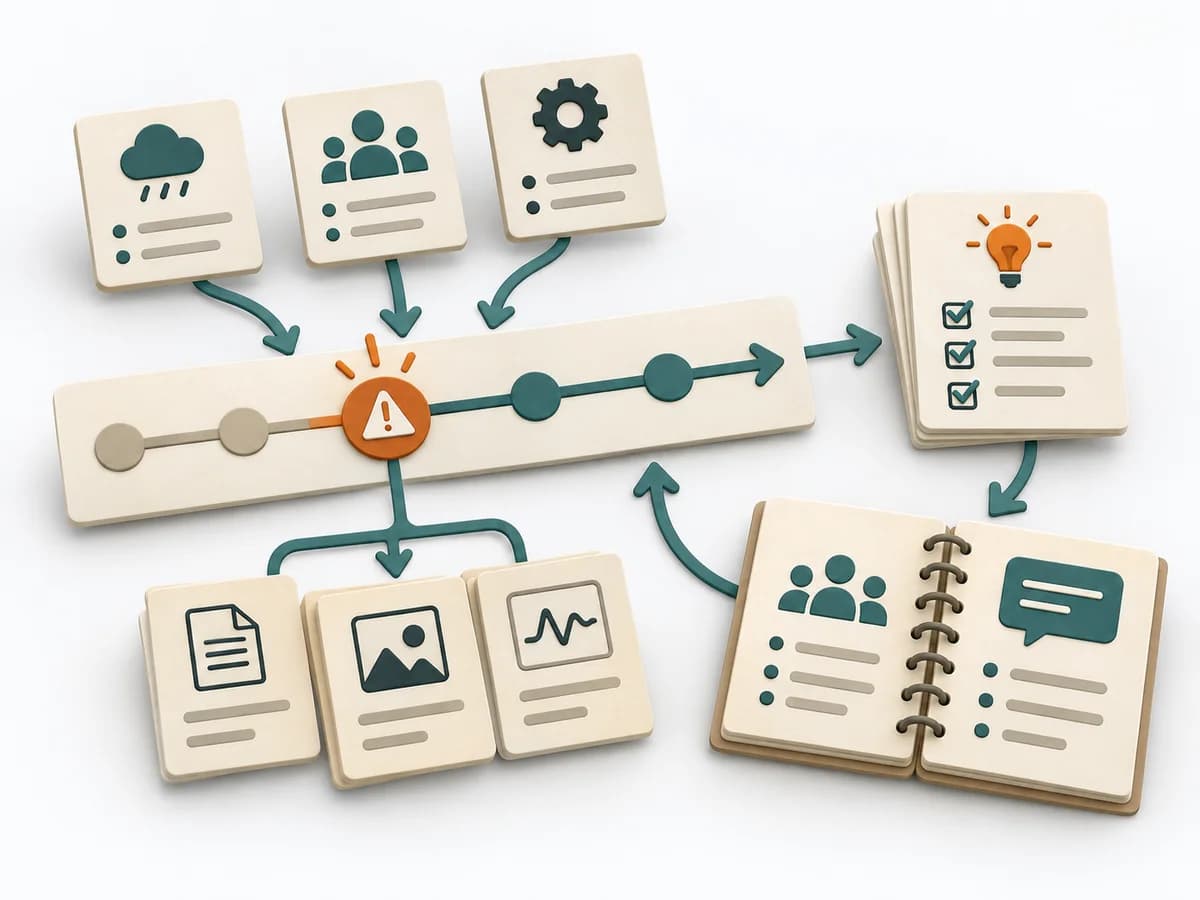 DevOps Blameless Postmortem | 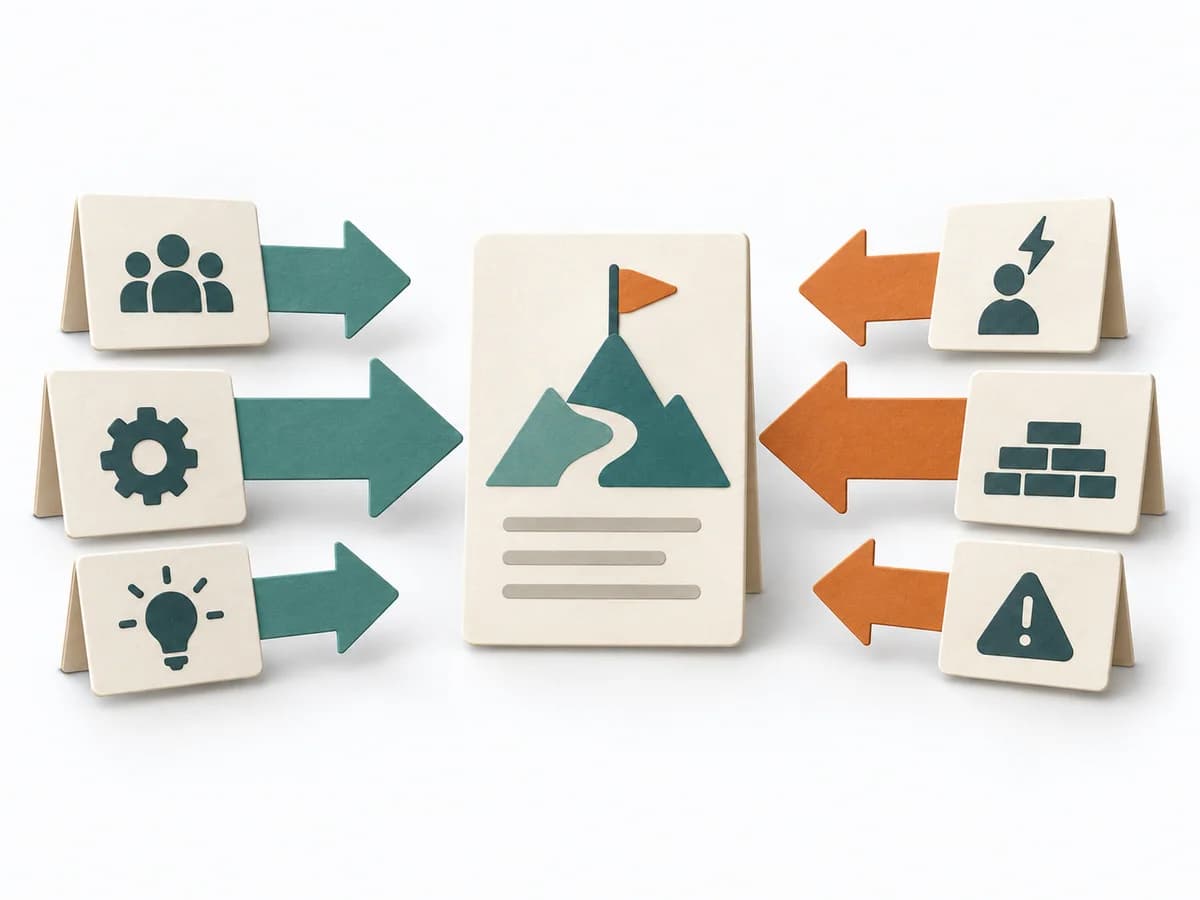 Decision Making Force Field Analysis |
|---|---|---|---|
Purposedifferent | Wardley Mapping makes visible where an offering stands today and where it can evolve. The method connects user need, value chain, and evolution stages into a strategic basis for platform, build, or buy decisions. | After an incident with damage or a near miss, the method creates a sober field for learning without assigning blame. It directs attention to the course of events, conditions, and effective countermeasures. | In change initiatives, supporting and restraining forces sit at the table at the same time. Force Field Analysis makes these tensions explicit and shows where change can be pushed forward by strengthening or relieving. |
Complexitydifferent | Medium | Medium | Low |
Timedifferent | 1-3 h | 30-90 min | 45-90 min |
Participantsdifferent | 2-10 | 3-12 | 3-12 |
Formatdifferent | Workshop + async | Workshop + async | Workshop |
Outputdifferent | Wardley Map, Strategic Options, Evolution Notes | Postmortem Doc, Action Items, Timeline | Force Field Map, Change Levers, Risk Notes |
Tagsno overlap | StrategySystems thinkingDynamics | Site Reliability EngineeringIncidentLearningReliability | ChangeDecisionStrategy |
Often compared together
Methods with strong topical overlap with the current selection, not yet in the comparison.