View methods side by side.
Choose up to four methods. Add them using the search and share the comparison by copying its link.
| Criterion |  Operations Visual Management |  Product Strategy Value Proposition Canvas |  Product Discovery Opportunity Scoring |
|---|---|---|---|
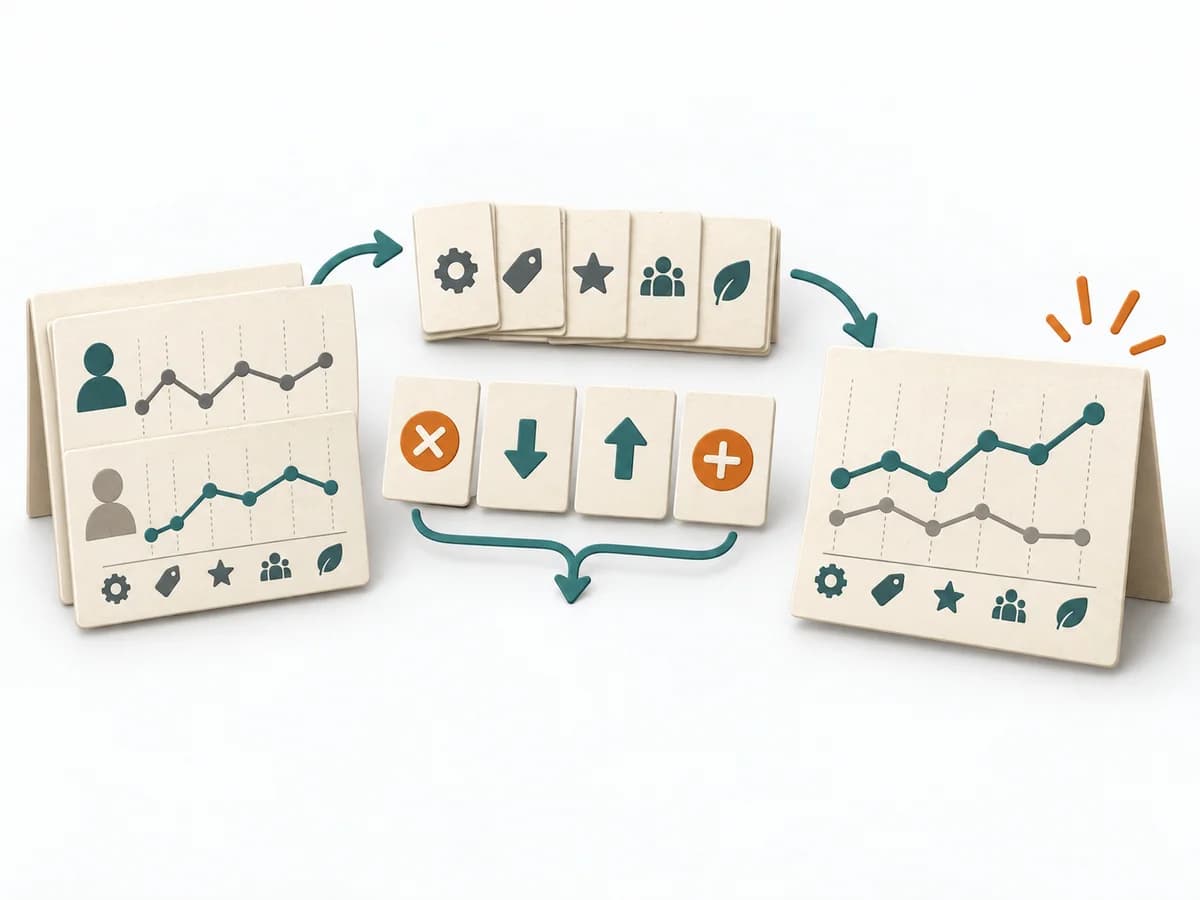
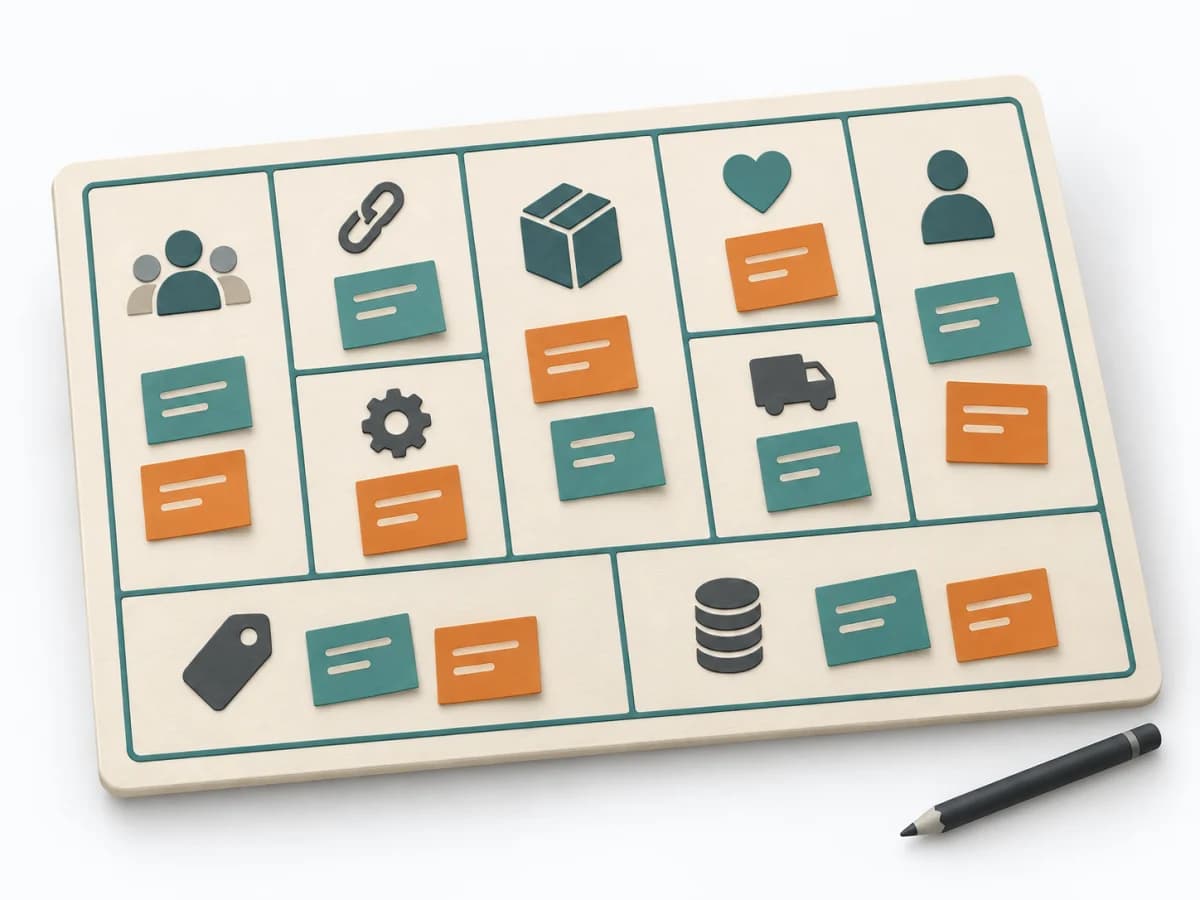
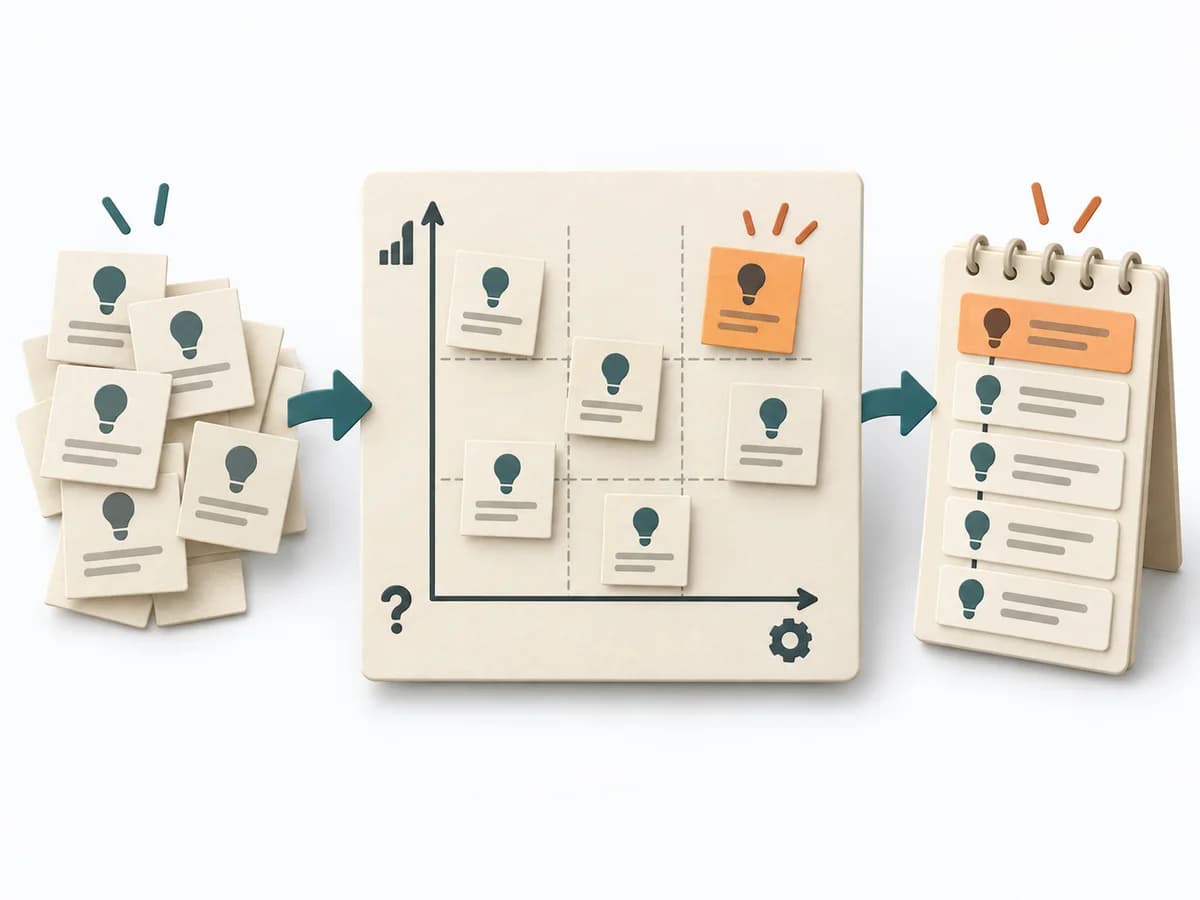
Purposedifferent | With high tempo and many parallel topics, the method makes status, deviations, and priorities visible at a glance. It reduces search effort and prevents what matters from getting lost in daily work. | When the value proposition and customer expectation drift apart, it makes fit and mismatch legible. It shows where offering and need don't yet come together. | When opportunities need ranking by their effect, it makes importance and satisfaction directly comparable. It separates problem, assumption, solution, and evidence. The result is captured as an opportunity-score table and top outcomes. |
Complexitydifferent | Low | Medium | Medium |
Timedifferent | Ongoing | 1-2 h | 60-120 min |
Participantsdifferent | 1-20 | 2-8 | 3-6 |
Formatsame | Workshop + async | Workshop + async | Workshop + async |
Outputdifferent | Visual Board, Status Indicators, Exception Cues | Value Proposition Canvas, Fit Gaps, Hypotheses | Opportunity Score Table, Top Outcomes |
Tagsno overlap | SignalsOperationsVisual management | ValueNeedsStrategy | PrioritizationDiscoveryOutcomesNeeds |
Often compared together
Methods with strong topical overlap with the current selection, not yet in the comparison.