View methods side by side.
Choose up to four methods. Add them using the search and share the comparison by copying its link.
| Criterion |  Product Strategy Value Proposition Canvas | 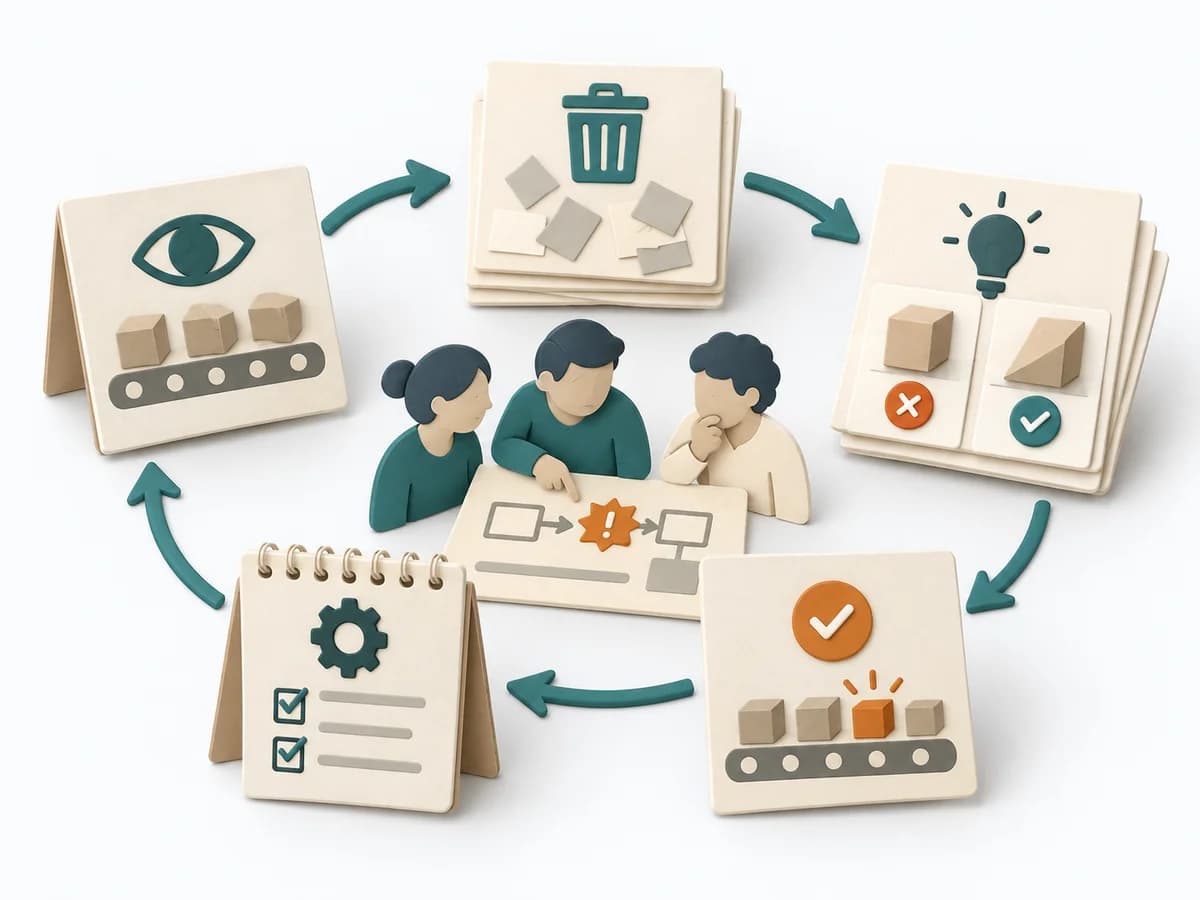 Operations Kaizen Event |  Operations Root Cause Analysis |
|---|---|---|---|
Purposedifferent | When the value proposition and customer expectation drift apart, it makes fit and mismatch legible. It shows where offering and need don't yet come together. | For a tightly scoped process segment with noticeable waste, the method bundles shared energy for change. It suits situations that call for fast learning loops and visible adjustments. | When a problem keeps recurring and the cause stays unclear, the method exposes the underlying mechanism. It separates symptom, guess, and robust explanation from one another. |
Complexitysame | Medium | Medium | Medium |
Timedifferent | 1-2 h | 0.5-5 Tage | 1-4 h |
Participantsdifferent | 2-8 | 4-10 | 3-8 |
Formatdifferent | Workshop + async | Workshop | Workshop + async |
Outputdifferent | Value Proposition Canvas, Fit Gaps, Hypotheses | Kaizen Charter, Waste List, Improvement Experiments, Standard Work Update | Problem Statement, Cause Hypotheses, Confirmed Causes, Action Plan |
Tagsno overlap | ValueNeedsStrategy | LeanContinuous improvementOperations | Root causeProblem solvingQualityIncident |
Often compared together
Methods with strong topical overlap with the current selection, not yet in the comparison.



