View methods side by side.
Choose up to four methods. Add them using the search and share the comparison by copying its link.
| Criterion | 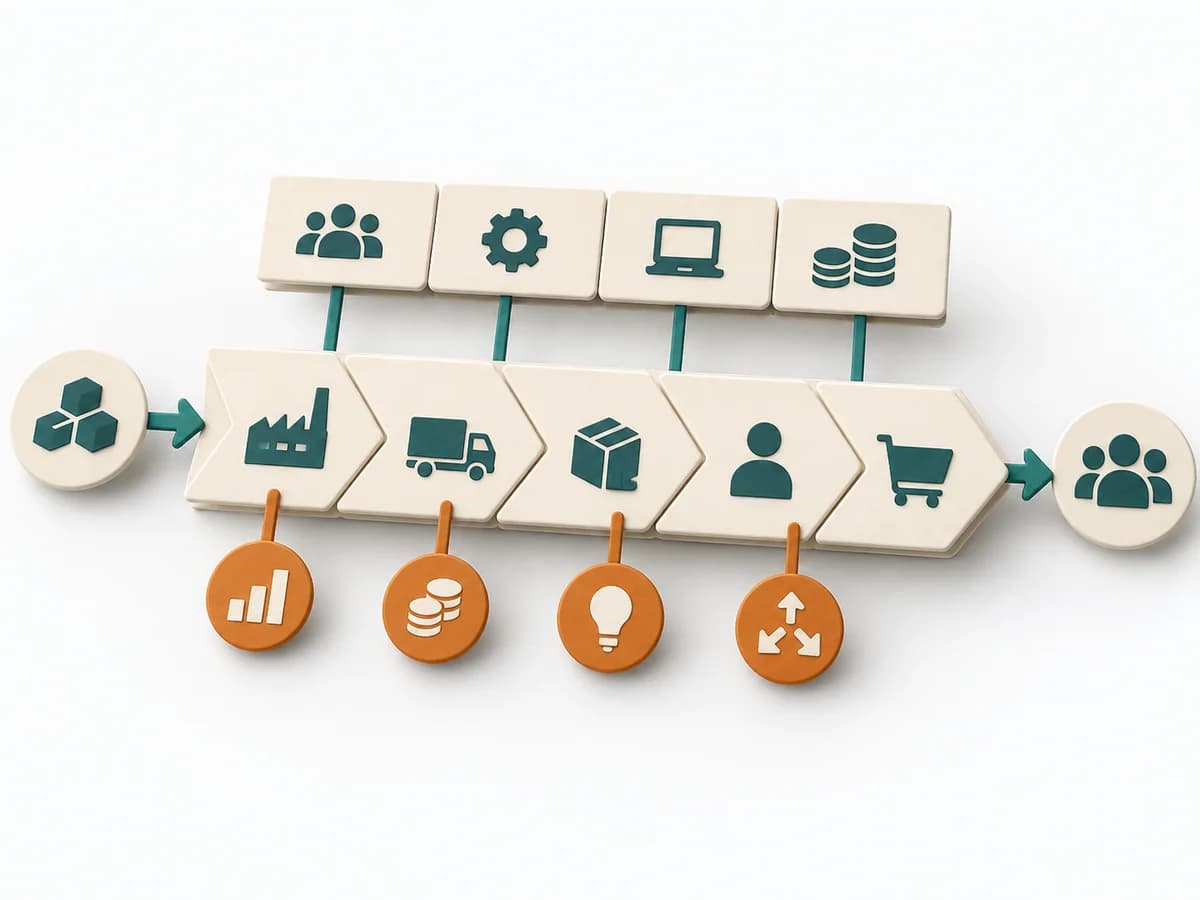 Business Strategy Value Chain Analysis | 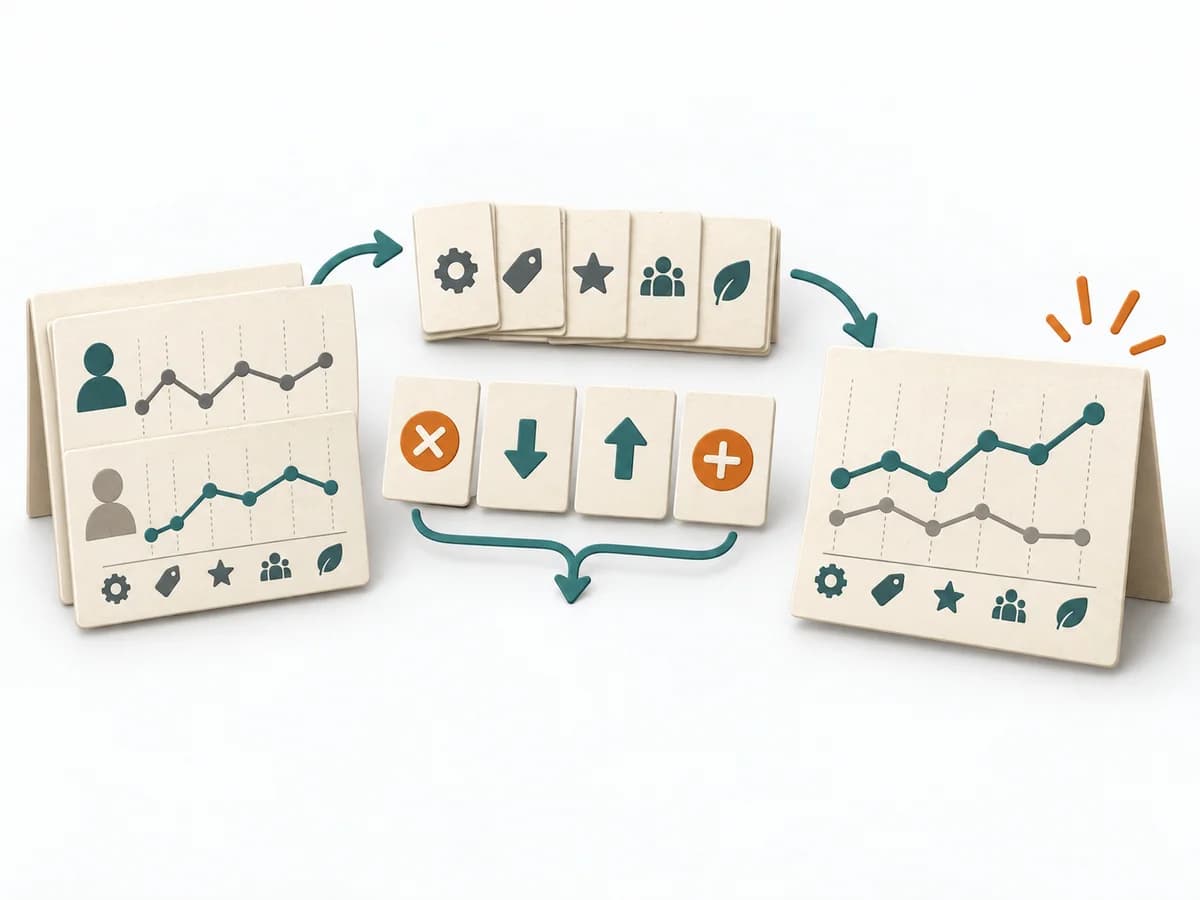 Business Strategy Blue Ocean Strategy Canvas |  Architecture ATAM (Architecture Tradeoff Analysis Method) |
|---|---|---|---|
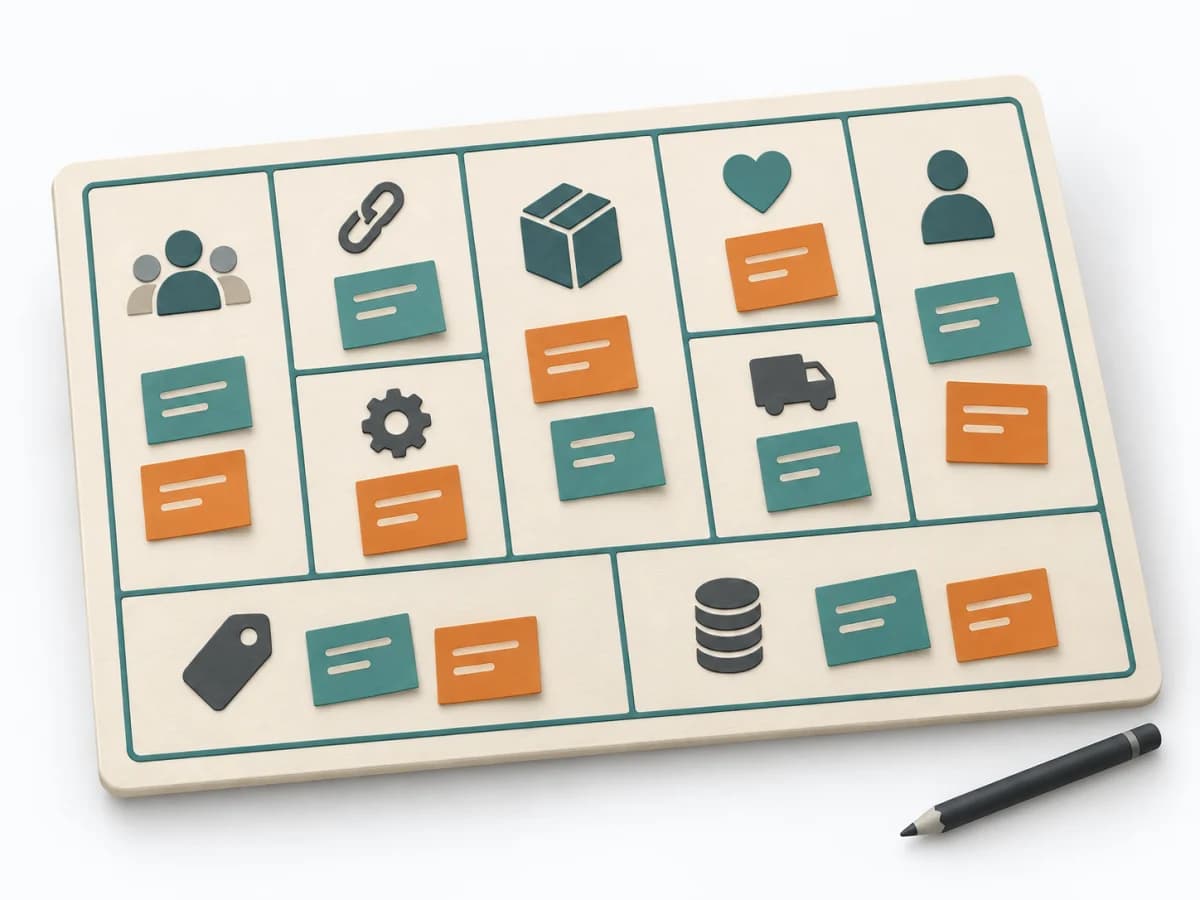
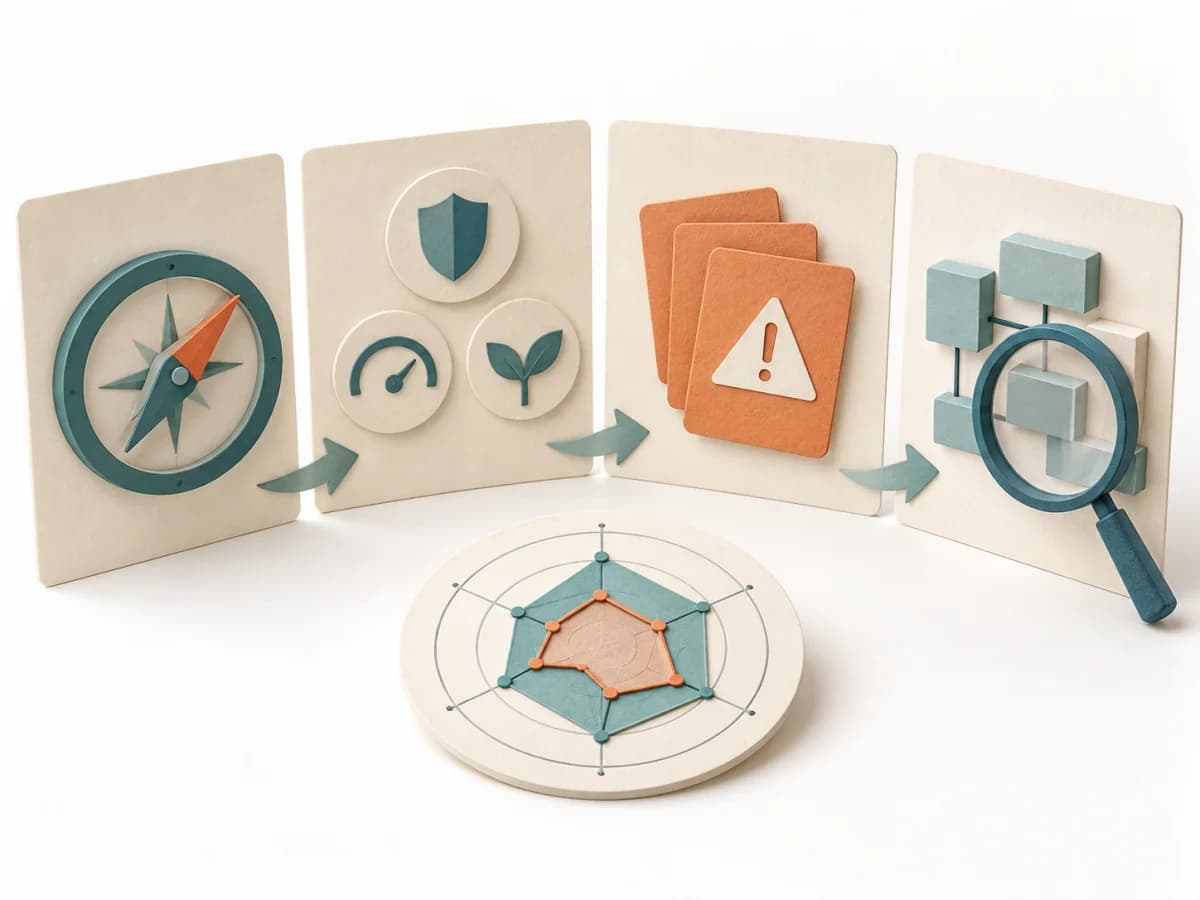
Purposedifferent | Value Chain Analysis shows where value is created, costs accrue, and differentiation becomes possible along the process. It compares strengths, risks, market logic, and courses of action. The result is captured as a value-chain map and lever list. | The Blue Ocean Strategy Canvas shows how an offering is positioned relative to the market. Differentiation thereby becomes tangible in value factors instead of merely being claimed. | ATAM helps teams weigh architecture decisions when quality goals compete. The team considers business goals, stakeholder expectations, and technical decisions together. The evaluation shows which risks need further investigation. |
Complexitydifferent | High | Medium | High |
Timedifferent | Half day | 2-4 h | Several meetings plus preparation and analysis; total effort depends on scope |
Participantsdifferent | 3-8 | 3-10 | Evaluation team, architects, and relevant stakeholders |
Formatdifferent | Workshop | Workshop | Workshop + async |
Outputdifferent | Value Chain Map, Lever List | Strategy Canvas, Value Curve, ERRC Actions | Prioritized quality scenarios in a utility tree, Architecture risks with reasoning and assumptions, Sensitivity and trade-off points, Findings report with open investigations |
Tagsno overlap | StrategyBusiness modelDiagnosisAnalysis | StrategyPositioningInnovationValue | ArchitectureQualityRiskTradeoffsStakeholders |
Often compared together
Methods with strong topical overlap with the current selection, not yet in the comparison.