View methods side by side.
Choose up to four methods. Add them using the search and share the comparison by copying its link.
| Criterion |  Product Discovery User Story Mapping | 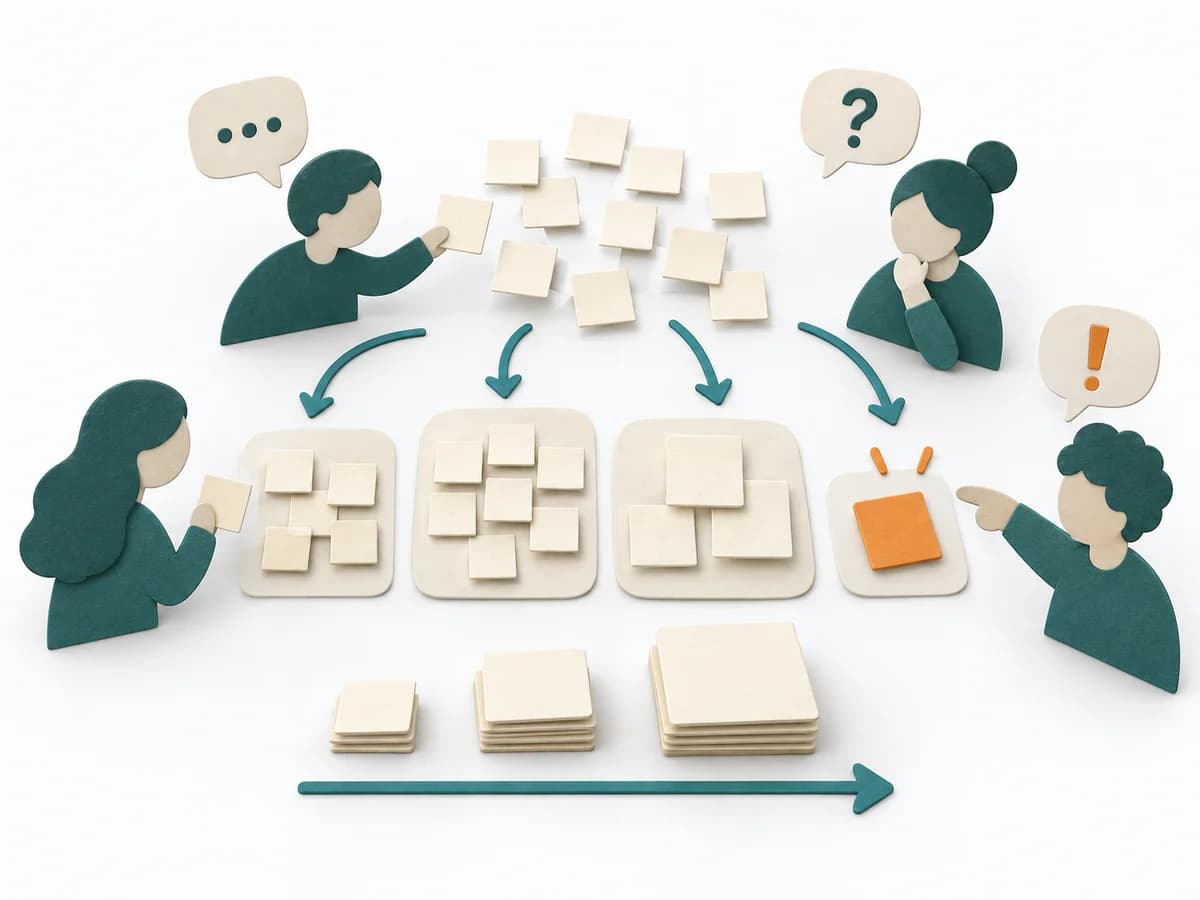 Agile Affinity Estimation |  Business Strategy PESTLE Analysis |
|---|---|---|---|
Purposedifferent | When user goals and delivery scope could drift apart, it orders the journey from goal to slice. It makes visible where an MVP can genuinely be cut. | When many tasks need to be classified quickly, it sorts them by perceived effort and similarity. It reduces the effort of fine-grained estimation for large volumes. | PESTLE Analysis makes political, economic, social, technological, legal, and environmental influences visible. The environment of an initiative is thereby read systematically instead of through isolated trends. |
Complexitysame | Medium | Medium | Medium |
Timedifferent | 2-4 h | 30-90 min | 1-3 h |
Participantsdifferent | 4-10 | 3-12 | 2-10 |
Formatdifferent | Workshop | Workshop | Workshop + async |
Outputdifferent | Story Map, Release Slices, Backlog Candidates | Affinity Size Map, Grouped Estimates, Unclear Items | PESTLE Map, External Risks, Strategic Questions |
Tagsno overlap | BacklogJourneyPlanningMVP | EstimationBacklogRelative sizing | StrategyMarketAnalysis |
Often compared together
Methods with strong topical overlap with the current selection, not yet in the comparison.