View methods side by side.
Choose up to four methods. Add them using the search and share the comparison by copying its link.
| Criterion | 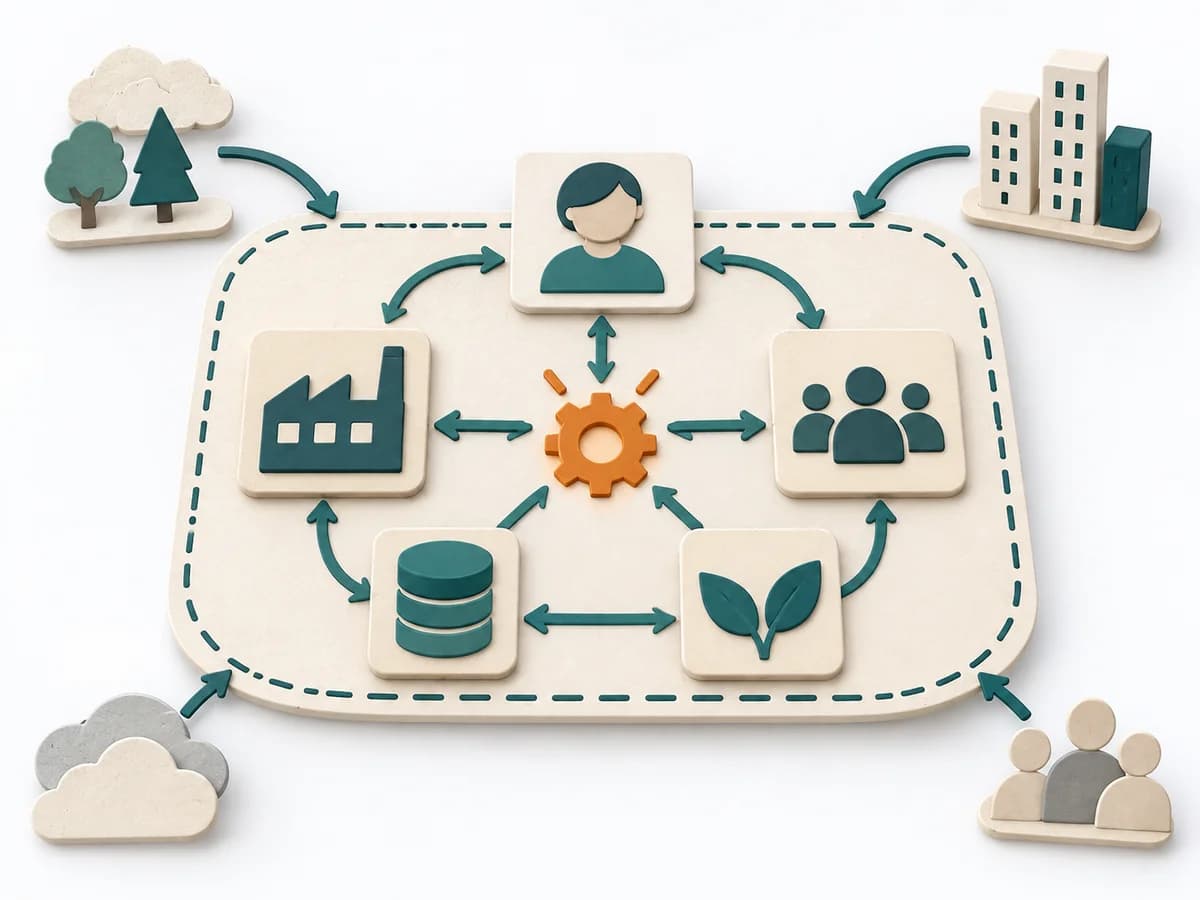 Systems Thinking Systems Mapping | 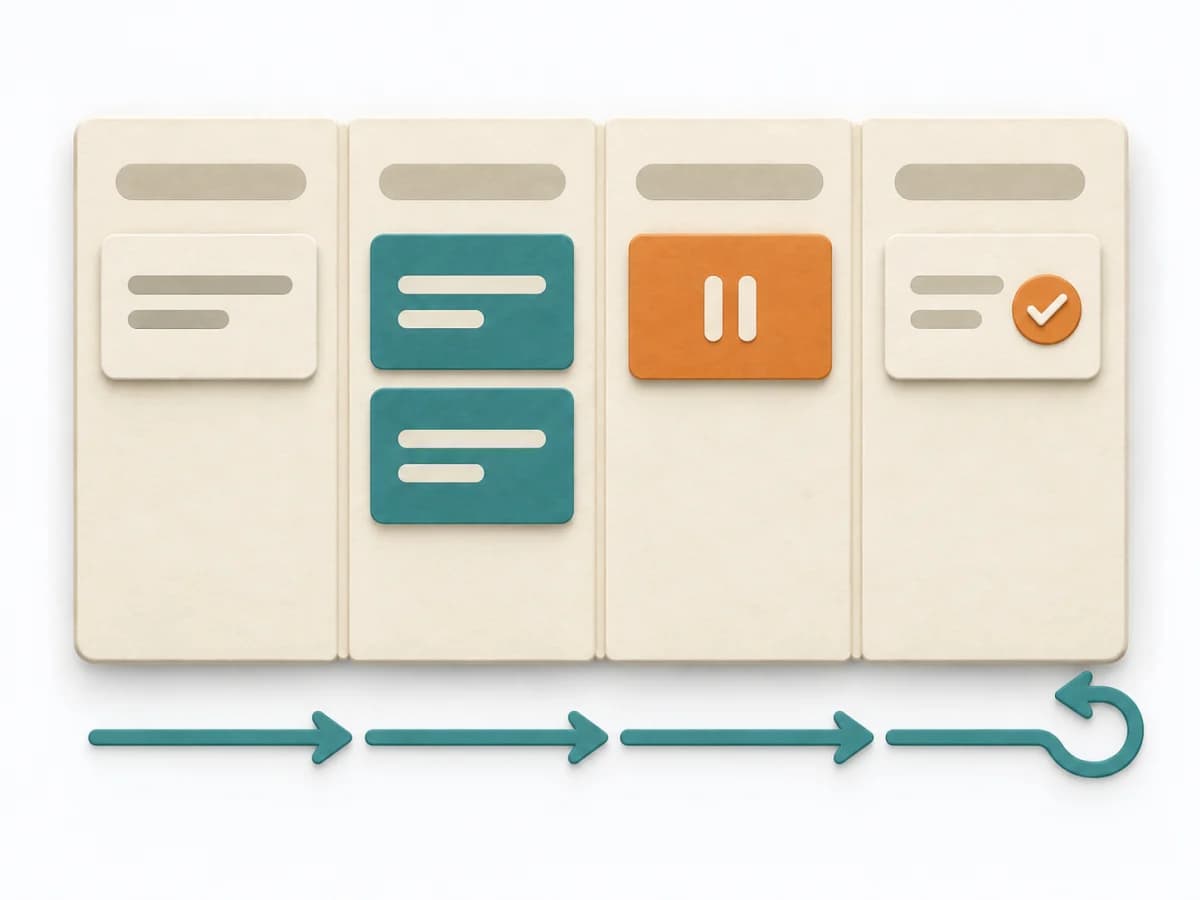 Engineering Kanban |  Delivery Monte Carlo Forecasting |
|---|---|---|---|
Purposedifferent | Systems Mapping arranges elements, relationships, and boundaries so a complex field becomes legible at a glance. The overview stabilizes the overall picture before detail work or steering begins. | When work sits in too many parallel streams, throughput suffers and no one sees the bottlenecks. Kanban makes the flow of work visible and limits overload so a system becomes calmer and more predictable. | Helps clarify scope, sequence, and delivery flow in concrete terms. It makes work, boundaries, and order steerable. The result is captured as Forecast Percentiles, Throughput Dataset, and Risk Communication. |
Complexitydifferent | Medium | Medium | High |
Timedifferent | 1-3 h | Ongoing | 30-90 min Setup, danach laufend |
Participantsdifferent | 3-12 | 2-12 | 1-8 |
Formatsame | Workshop + async | Workshop + async | Workshop + async |
Outputdifferent | System Map, Dependencies, Leverage Points | Kanban board, WIP policies, Flow metrics | Forecast Percentiles, Throughput Dataset, Risk Communication |
Tagsno overlap | Systems thinkingMappingBoundariesChange | FlowVisual managementDelivery | ForecastingFlowDelivery |
Often compared together
Methods with strong topical overlap with the current selection, not yet in the comparison.