View methods side by side.
Choose up to four methods. Add them using the search and share the comparison by copying its link.
| Criterion |  Business Strategy Strategy Map |  Decision Making Pre-Mortem |  Product Strategy OKRs |
|---|---|---|---|
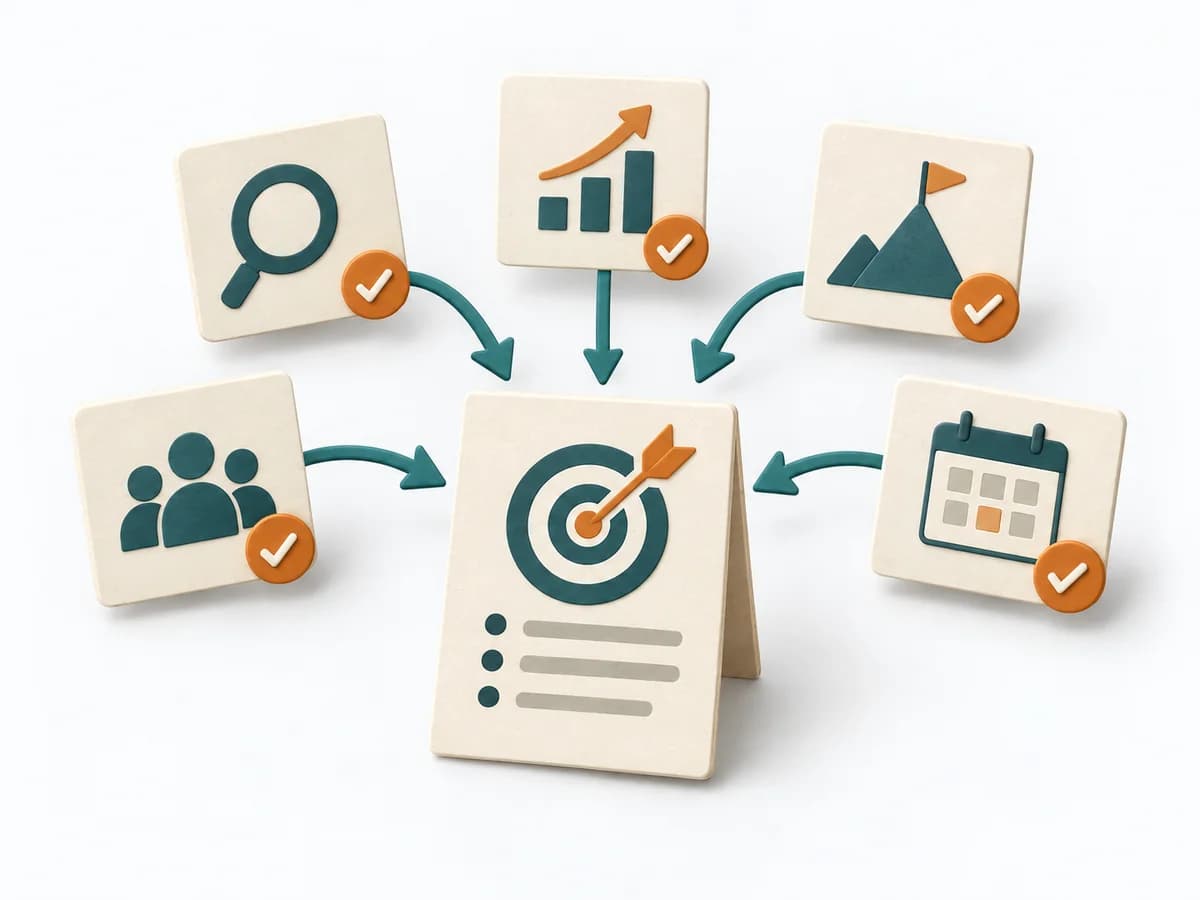
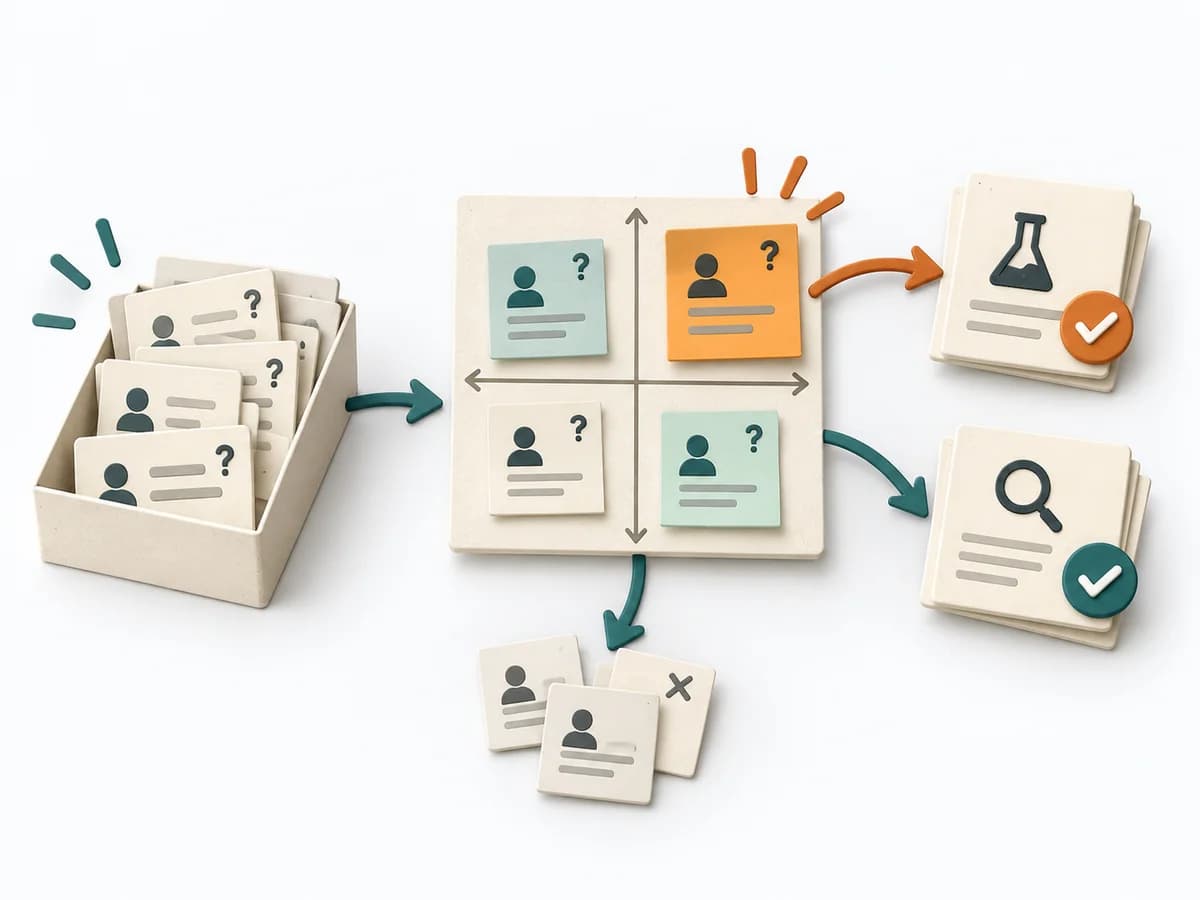
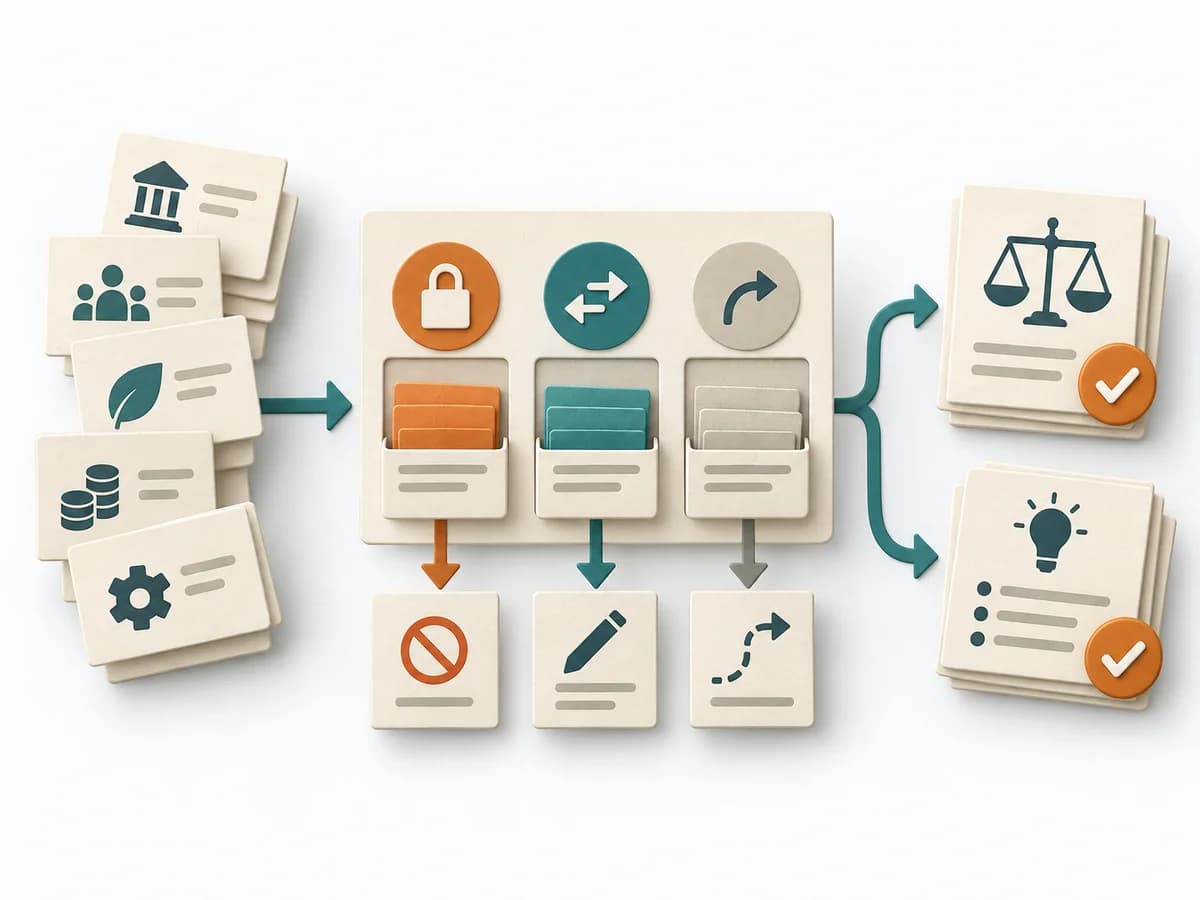
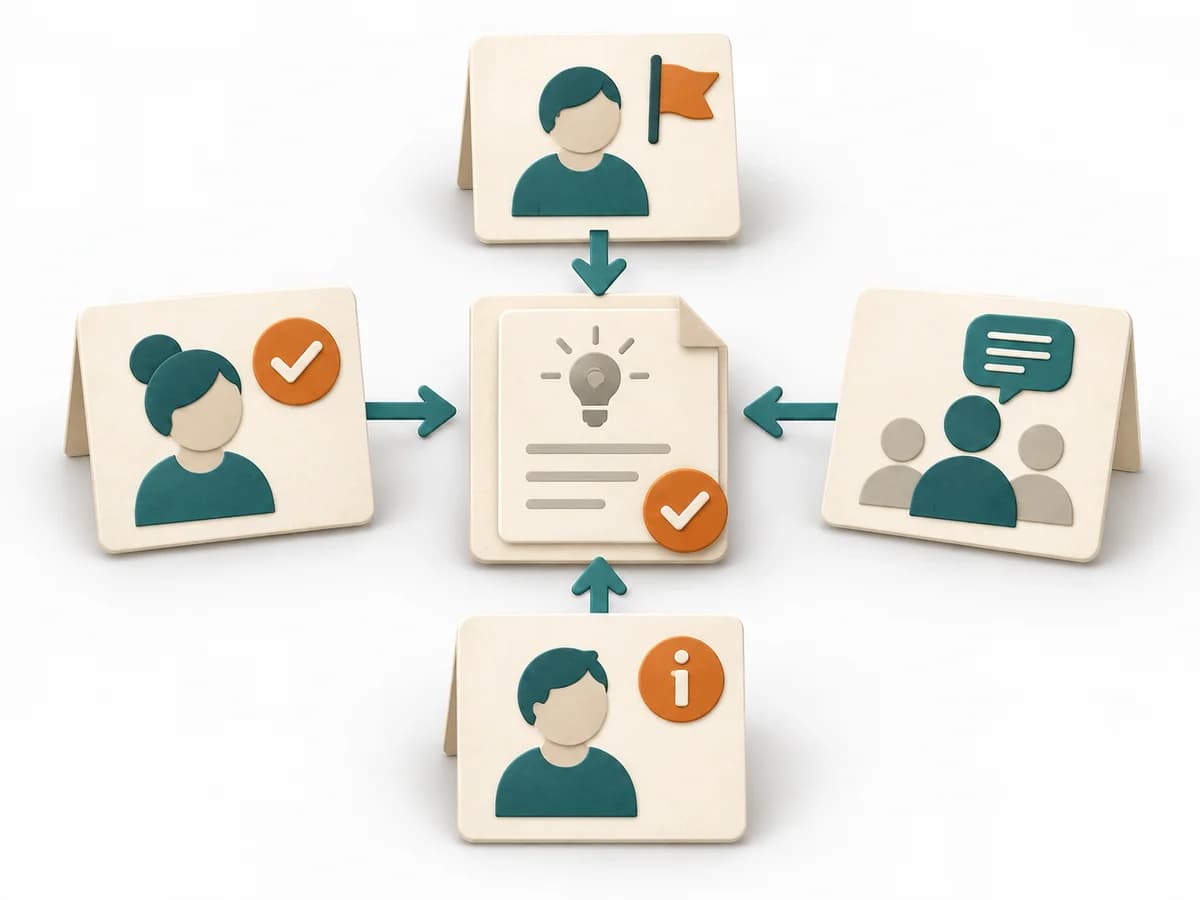
Purposedifferent | A Strategy Map translates strategy into a few connected objectives across perspectives such as finance, customers, processes, and learning. This makes visible which capabilities and activities are meant to drive which results. | In early initiatives with many uncertainties, planning quickly turns too optimistic. A pre-mortem makes the expected failure visible in advance and sharpens the view of causes, gaps, and countermeasures. | When strategic direction needs to become measurable, it connects ambition with checkable results. It makes goals connectable to focus and review. |
Complexitydifferent | Medium | Low | Medium |
Timedifferent | 2-4 h workshop plus review | 20–45 min | 1-2 h Setup |
Participantsdifferent | 4-10 | Small cross-functional group | 2-20 |
Formatdifferent | Workshop | Workshop | Workshop + async |
Outputdifferent | Strategy Map, Objective Set, Cause-Effect Hypotheses | Risk list, Mitigation plan, Assumption log | OKR set, Measurement plan, Review cadence |
Tagsno overlap | AlignmentExecutionGoalsCausality | RiskDecisionFailurePlanning | GoalsAlignmentOutcomesMeasurement |
Often compared together
Methods with strong topical overlap with the current selection, not yet in the comparison.