View methods side by side.
Choose up to four methods. Add them using the search and share the comparison by copying its link.
| Criterion |  Product Discovery Smoke Test | 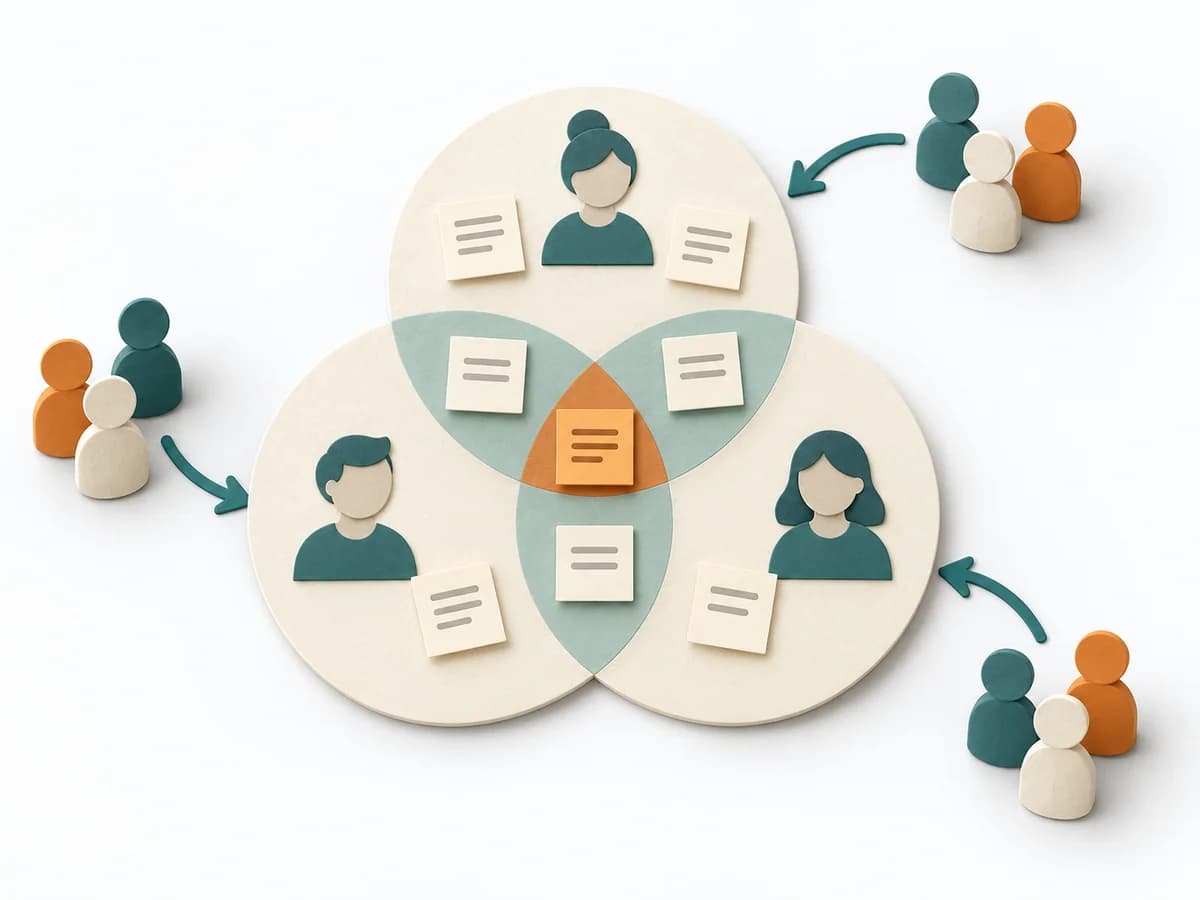 Facilitation 3-Circle Venn Diagram |  Facilitation Stakeholder Mapping |
|---|---|---|---|
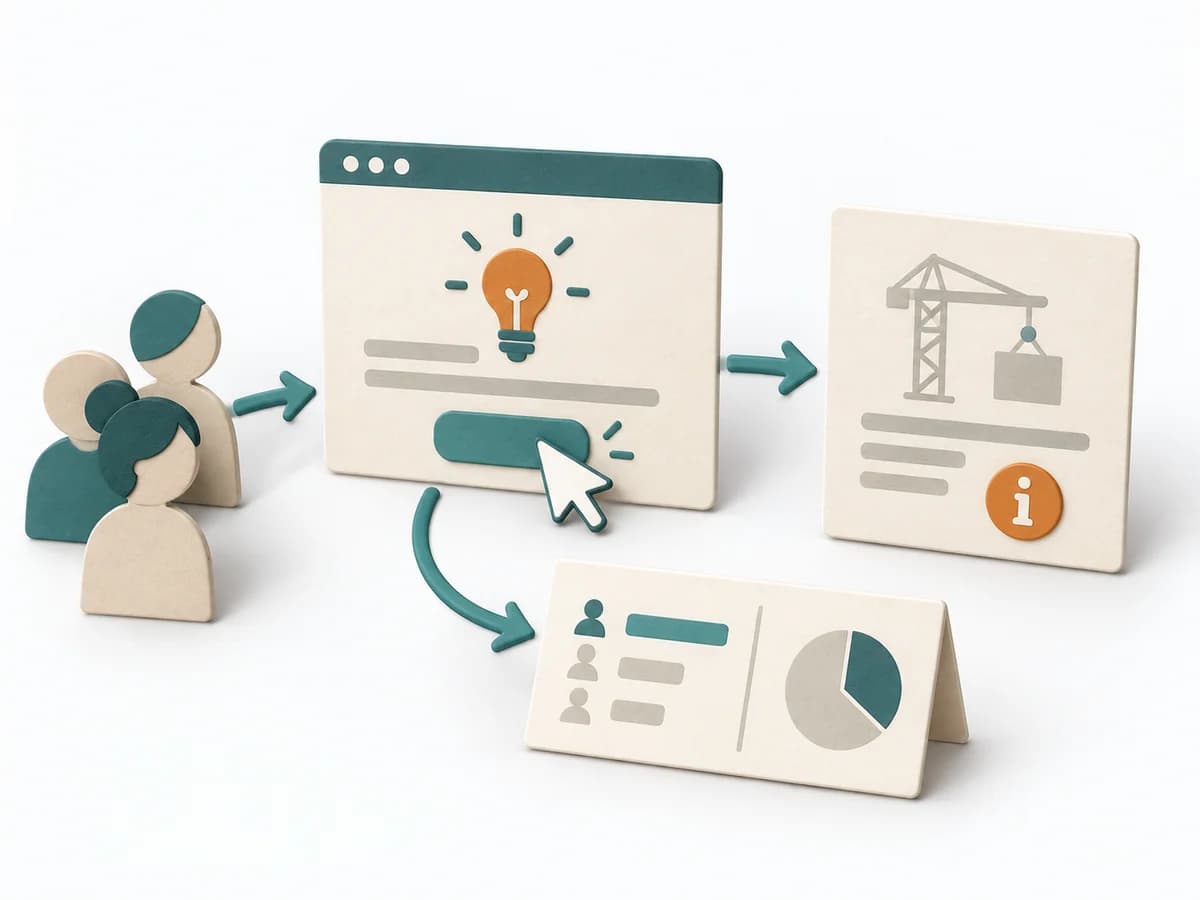
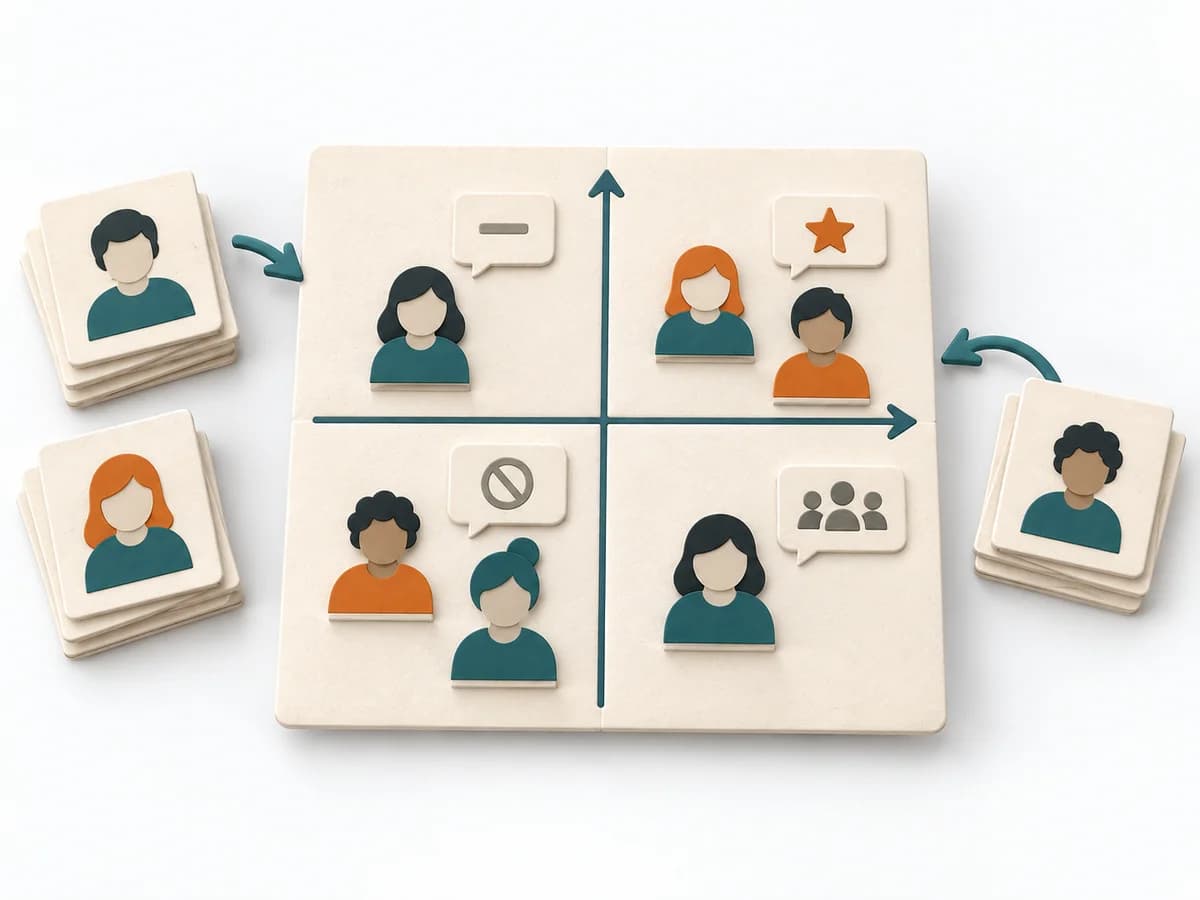
Purposedifferent | When demand only needs to be roughly verified, it tests interest with minimal effort. It measures whether people would take a next step at all. | When three perspectives matter at the same time, a Three-Circle Venn Diagram shows the overlaps and remainders precisely. It makes visible where shared effect arises and where only a partial perspective applies. | When an initiative depends on many people, interests, and power dynamics, Stakeholder Mapping systematically orders the environment. It shows who influences, who is affected, and where relationship management or safeguarding matters first. |
Complexitysame | Low | Low | Low |
Timedifferent | 1-5 Tage | 15-45 min | 60–90 min |
Participantsdifferent | Nutzertraffic | 2-8 | 2-8 |
Formatdifferent | Async | Workshop + async | Workshop + async |
Outputdifferent | Interest Metrics, Conversion Signal, Learning Note | Venn Diagram, Overlap Notes, Differentiators | Stakeholder Map, Engagement Plan, Risk Notes |
Tagsno overlap | ValidationExperimentsDemandGrowth | ComparisonFacilitationAlignment | StakeholdersAlignmentFacilitationChange |
Often compared together
Methods with strong topical overlap with the current selection, not yet in the comparison.