View methods side by side.
Choose up to four methods. Add them using the search and share the comparison by copying its link.
| Criterion |  Product Discovery Smoke Test |  UX Research Affinity Diagramming | 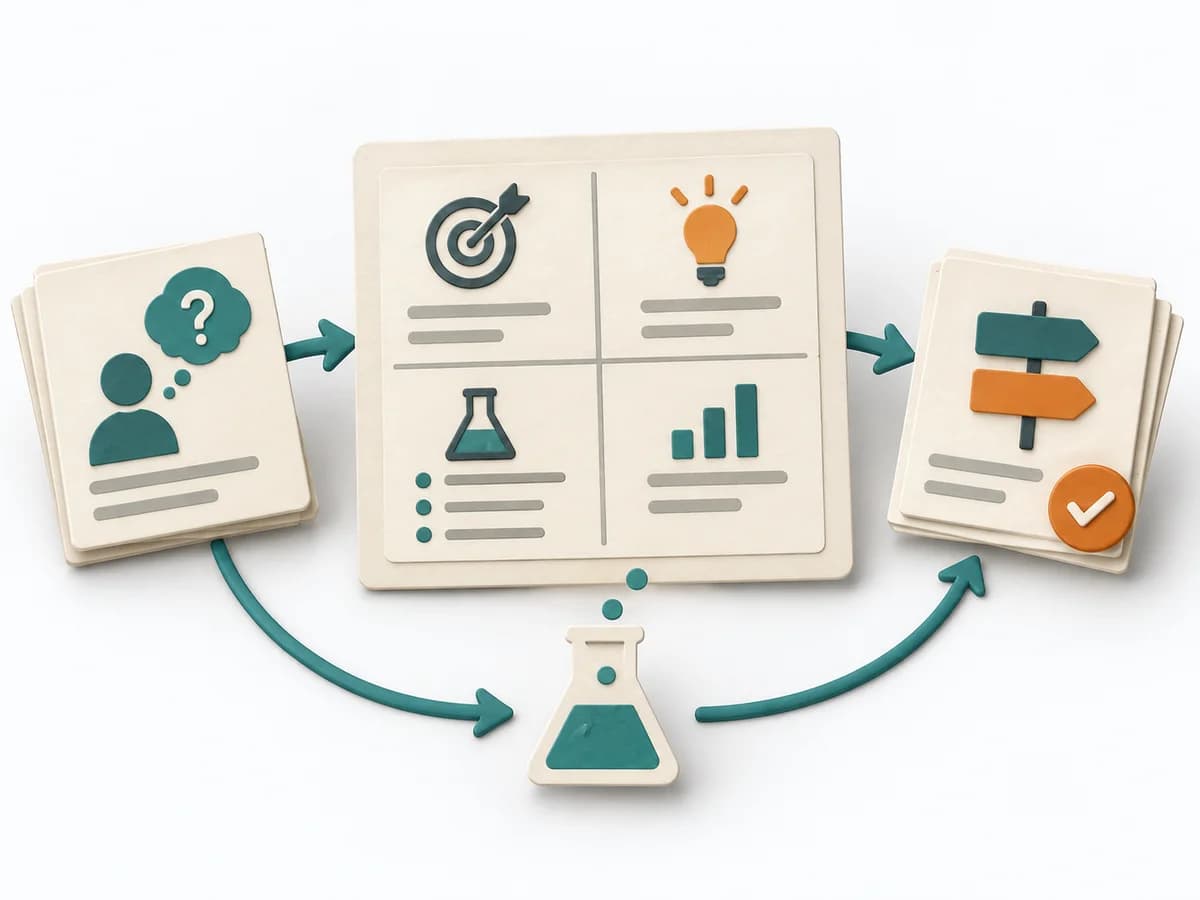 Product Discovery Experiment Canvas |
|---|---|---|---|
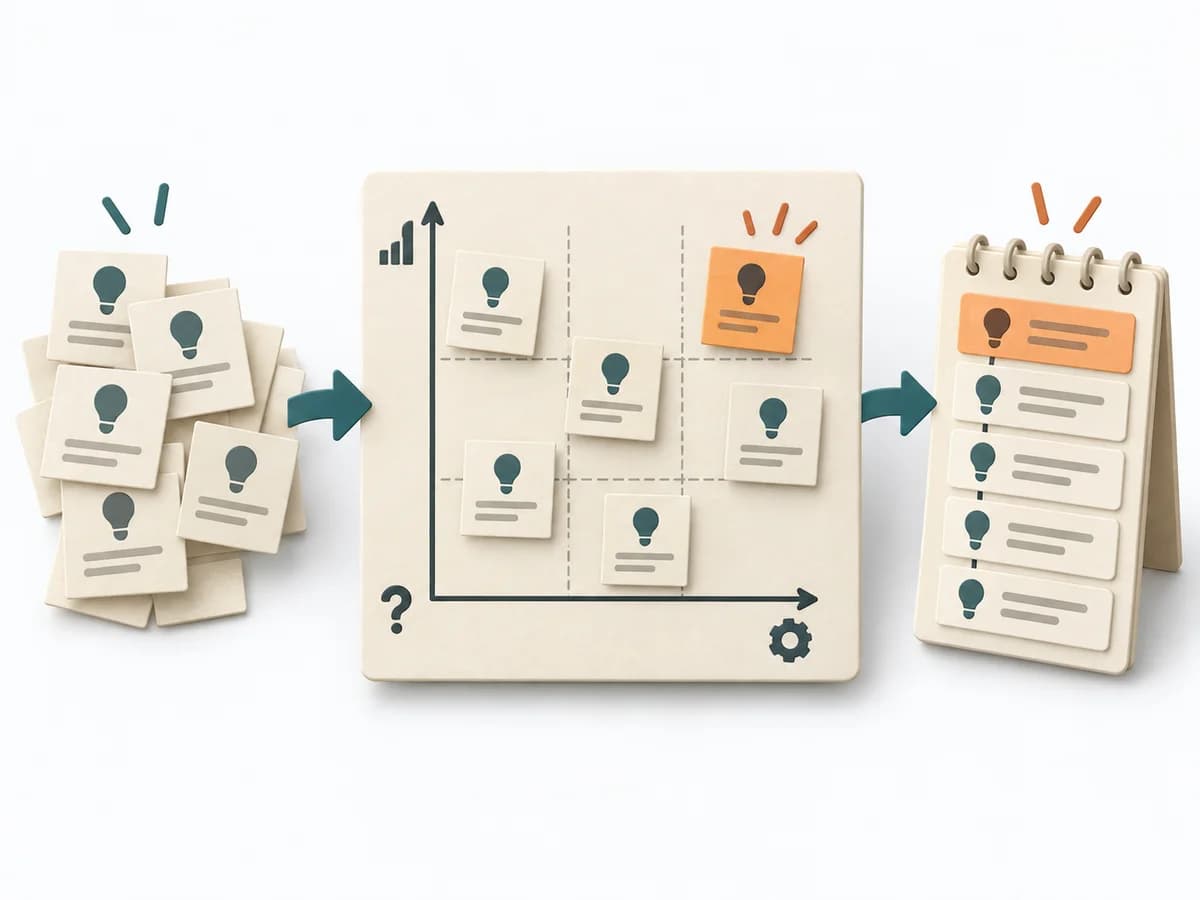
Purposedifferent | When demand only needs to be roughly verified, it tests interest with minimal effort. It measures whether people would take a next step at all. | When research notes, feedback, or observations sit unconnected side by side, affinity diagramming sorts the raw material into solid themes. Many individual points turn into patterns that make decisions and opportunities clearer. | When experiments become unreadable after the fact, it arranges hypothesis, signal, and learning goal on a single canvas. It separates problem, assumption, solution, and evidence. The result is captured as a Completed Experiment Canvas and a Success Metric. |
Complexitysame | Low | Low | Low |
Timedifferent | 1-5 Tage | 45–90 min | 30-60 min |
Participantsdifferent | Nutzertraffic | 3-10 | 1-5 |
Formatdifferent | Async | Workshop | Workshop + async |
Outputdifferent | Interest Metrics, Conversion Signal, Learning Note | Theme clusters, Insight statements, Opportunity areas | Completed Experiment Canvas, Success Metric |
Tagsno overlap | ValidationExperimentsDemandGrowth | SynthesisQualitativeRoot cause | ExperimentsValidationDiscoveryHypothesis |
Often compared together
Methods with strong topical overlap with the current selection, not yet in the comparison.