View methods side by side.
Choose up to four methods. Add them using the search and share the comparison by copying its link.
| Criterion | 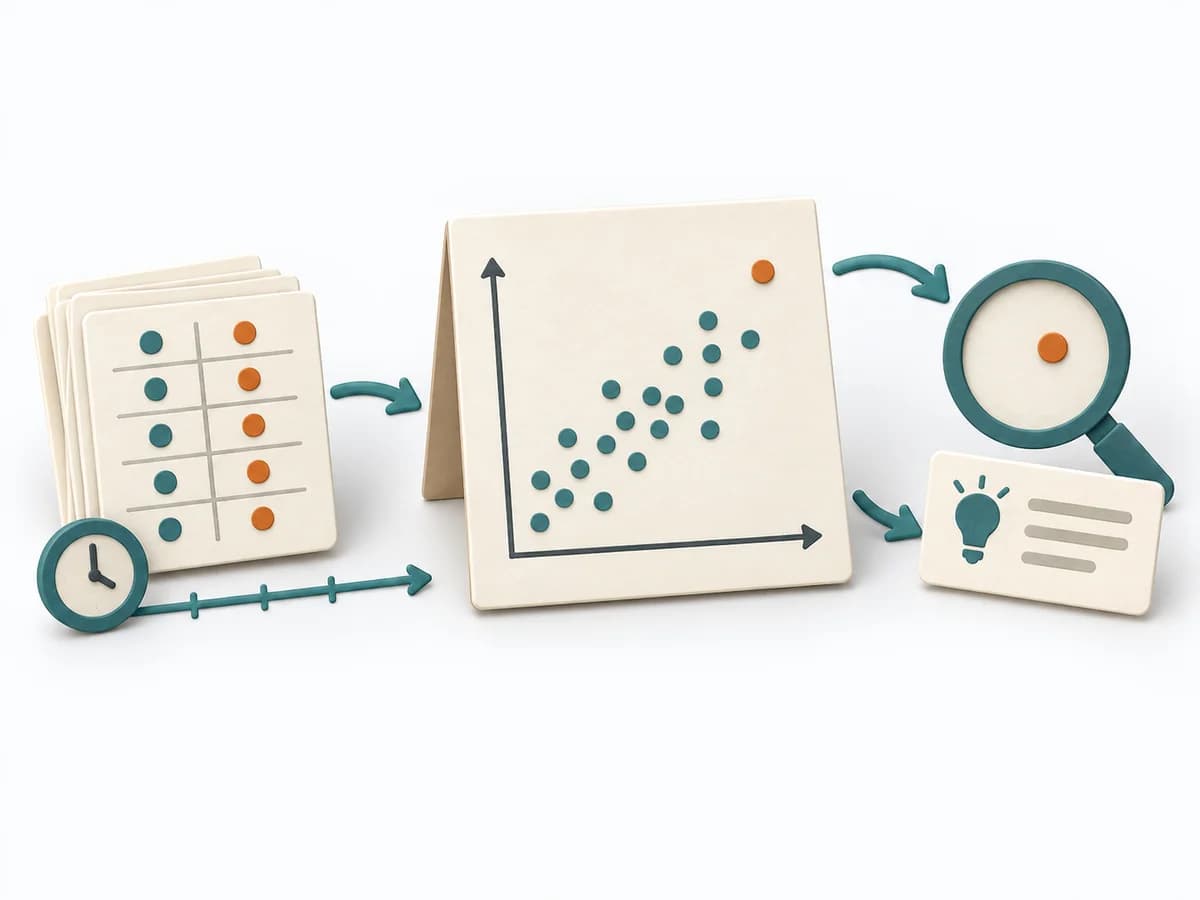 Operations Scatter Diagram |  Operations Root Cause Analysis | 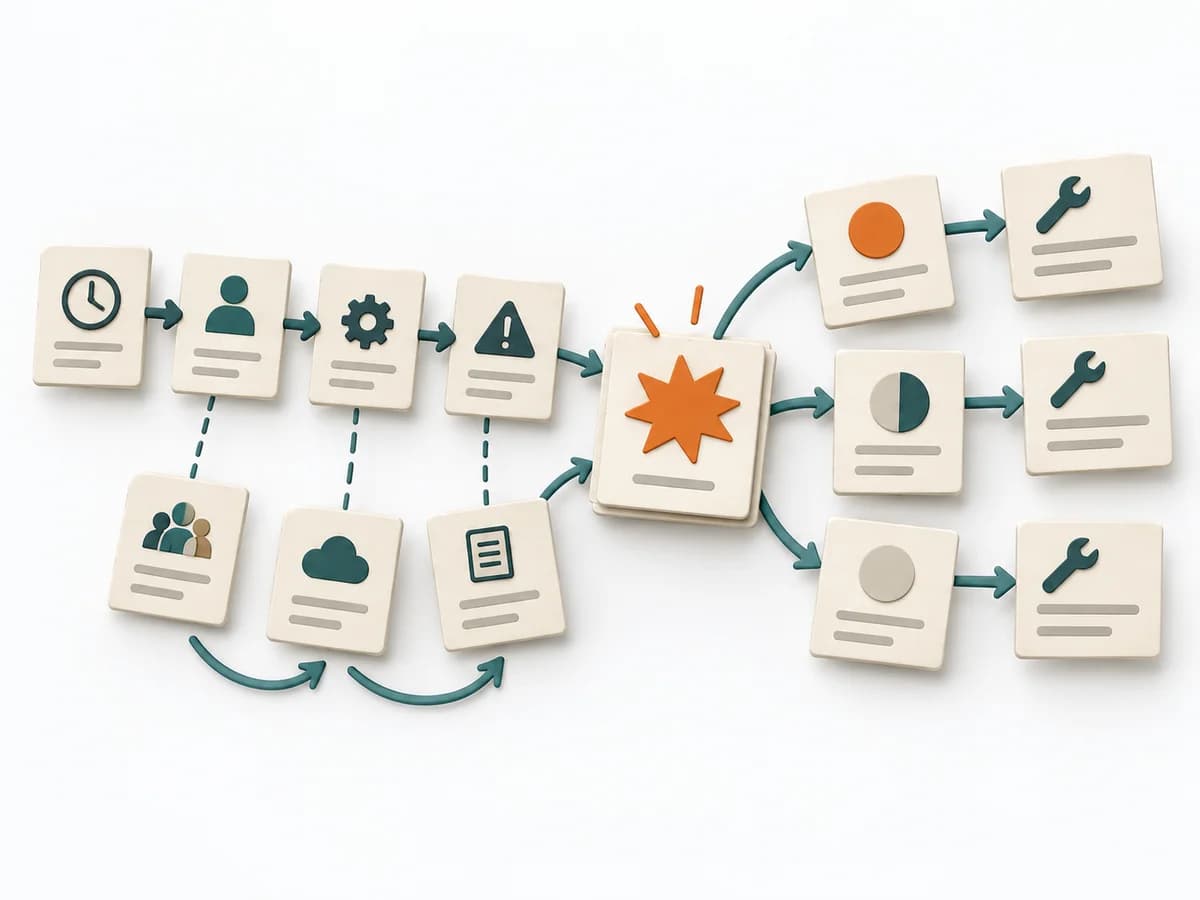 Operations Causal Factor Analysis |
|---|---|---|---|
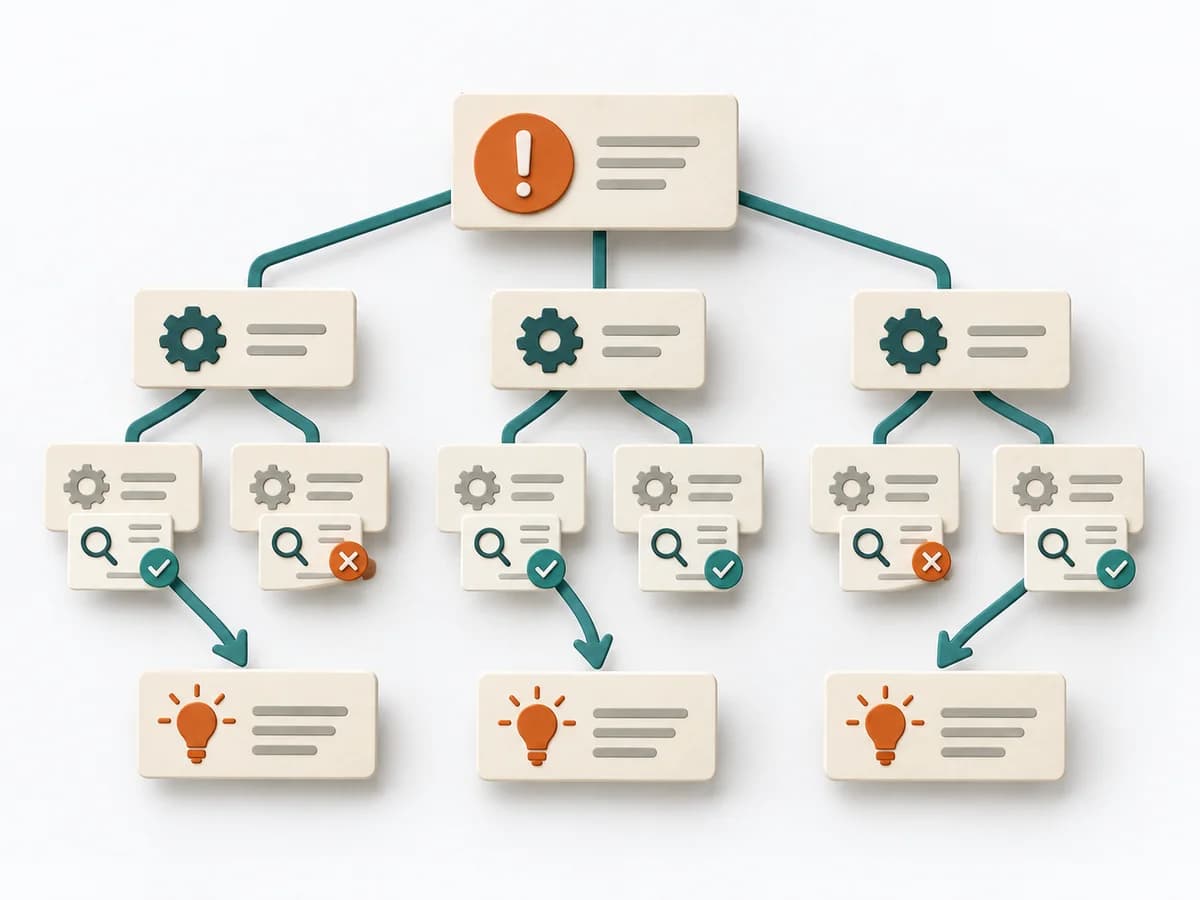
Purposedifferent | When the question is whether two measures are related, the method makes patterns in the data picture visible. It separates felt correlations from relationships that actually show up in the data. | When a problem keeps recurring and the cause stays unclear, the method exposes the underlying mechanism. It separates symptom, guess, and robust explanation from one another. | For an event with a complicated course, the method breaks down the contributing factors along the timeline. It shows how conditions, decisions, and reactions together produce a course of events. |
Complexitydifferent | Low | Medium | High |
Timedifferent | 30-90 min | 1-4 h | 2-6 h |
Participantsdifferent | 1-4 | 3-8 | 3-10 |
Formatsame | Workshop + async | Workshop + async | Workshop + async |
Outputdifferent | Scatter Plot, Korrelationsnotiz, Hypothesenliste | Problem Statement, Cause Hypotheses, Confirmed Causes, Action Plan | Event Timeline, Causal Factor Chart, Cause List, Corrective Actions |
Tags1 shared | Root causeQualityVisualization | Root causeProblem solvingQualityIncident | CausalityIncidentRoot causeTimeline |
Often compared together
Methods with strong topical overlap with the current selection, not yet in the comparison.