Purpose
When the question is whether two measures are related, the method makes patterns in the data picture visible. It separates felt correlations from relationships that actually show up in the data.
Operations Mapping tool
Visualizes the relationship between two quantitative variables and examines patterns, outliers, and groups.
A scatter diagram plots paired observations on x and y axes. Scales, units, horizon, missing data, and potential third variables belong in interpretation; correlation does not establish causality.
What pattern exists between X and Y, and which observations or groups need explanation?
Scatter Diagram uses paired x-y observations with axes, group encoding, and optional trend analysis. Assessments remain justified and context-bound.

Define variables
Specify X, Y, unit, population, and horizon.
Check data
Check missing data, duplicates, measurement errors, and range.
Diagram
Plot points with suitable scale and relevant segment encoding.
Interpret
Describe form, direction, strength, outliers, and alternatives.
Update after new evidence or a material context change and retain the previous version.
For two quantitative variables with paired observations and sufficient variation.
annotated scatter diagram with traceable sources, assumptions, and domain decisions.
Owners, dates, and next review for annotated scatter diagram.
Fictional worked example
paired x-y observations with axes, group encoding, and optional trend analysis as a precise working structure with a fictional example.
X/Y · unit · population
Review minutes / follow-ups; 142 cases.
Missing · exclusion · measurement error
One pause outlier corrected.
Form · direction · group
Positive; complex cases separate cluster.
Finding · alternative · next test
Segment; no causal claim.
The example demonstrates the domain logic of Scatter Diagram; worksheets remain blank.
Start with the core question: What pattern exists between X and Y, and which observations or groups need explanation?
When the question is whether two measures are related, the method makes patterns in the data picture visible. It separates felt correlations from relationships that actually show up in the data.
Measurement pairs are collected over a period and read as a scatter cloud. Direction, spread, and outliers produce an initial picture of possible relationships and the limits of what the data can say. This makes correlation checkable without prematurely mistaking it for causation.
A scatter diagram makes suspected relationships visible as a data pattern before causes are asserted. Clean measurement pairs, sufficient spread, and deliberate consideration of outliers determine how much the data can say. The scatter cloud helps strengthen or weaken hypotheses, or shows when segmentation becomes necessary.
Check whether both measures share the same period, the same unit, and the same context before interpreting the scatter cloud. The insight value often grows more from outliers than from a premature trend line. Close with a follow-up question for deeper analysis and avoid any premature claim about causation.
The method guide walks execution through 4 phases, timing, 4 pitfalls, and clear stop criteria.
Open method guideYour perspective
Your feedback helps shape the next improvements to methodatlas.
Plan Scatter Diagram around its domain steps and the concrete decision question.
To be confirmed
To be confirmed
Full workshop Time: 30–60 minutes
Complete this worksheet on paper or in your own document during the work.
X/Y · unit · population
...
Missing · exclusion · measurement error
...
Form · direction · group
...
Finding · alternative · next test
...
Enter only real input, sources, and decisions.
NIST Engineering Statistics Handbook: Scatter Plots
Expected artifact: variable contract
variable contract · source · uncertainty · next decision
Entry:
...
Expected artifact: clean dataset
clean dataset · source · uncertainty · next decision
Entry:
...
Expected artifact: scatter diagram
scatter diagram · source · uncertainty · next decision
Entry:
...
Expected artifact: analysis note
analysis note · source · uncertainty · next decision
Entry:
...
...
Method guide: https://methodatlas.meierhoff-systems.de/en/methods/scatter-diagram/run-sheet
Fitting alternatives with decision guidance, followed by other related methods.
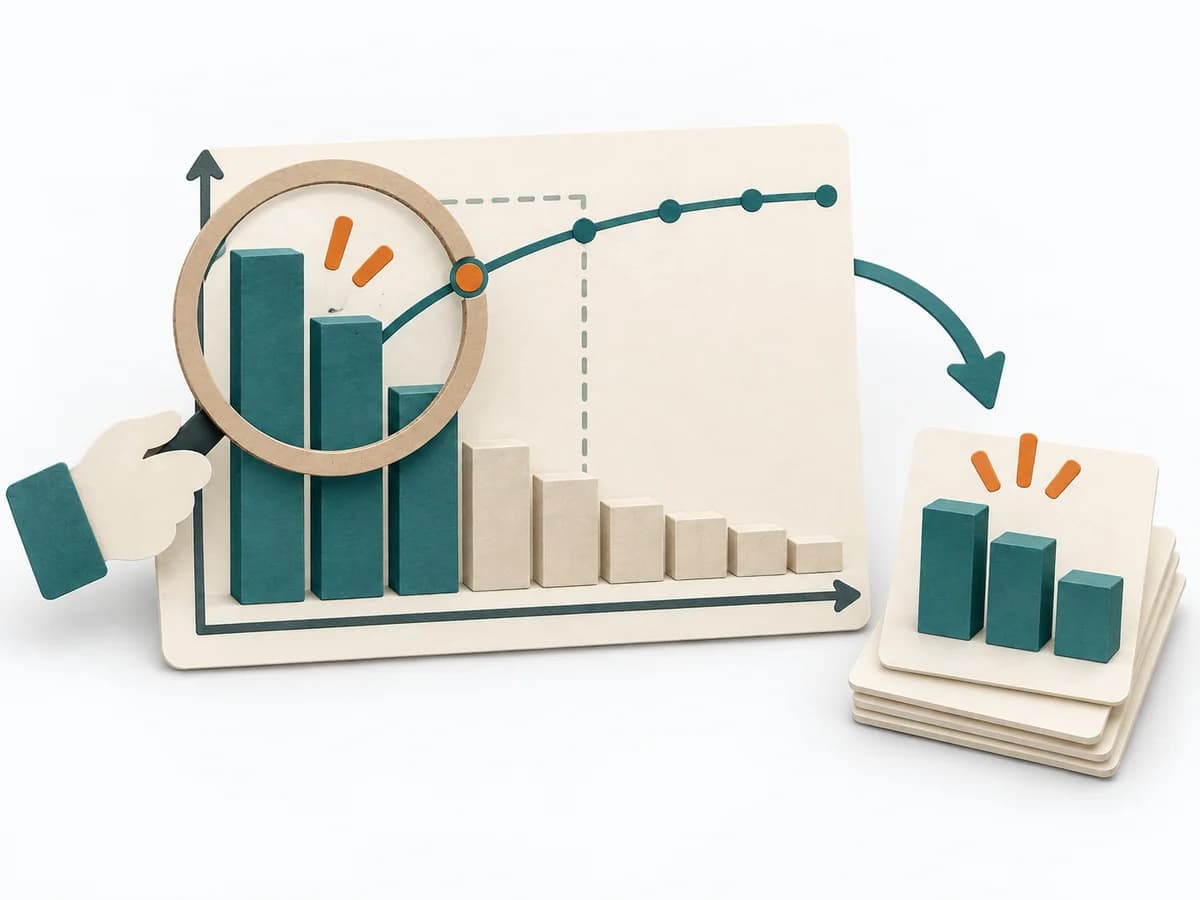
Instead of Scatter Diagram, choose Pareto Analysis when you want to prioritize the few most important drivers behind a result first.
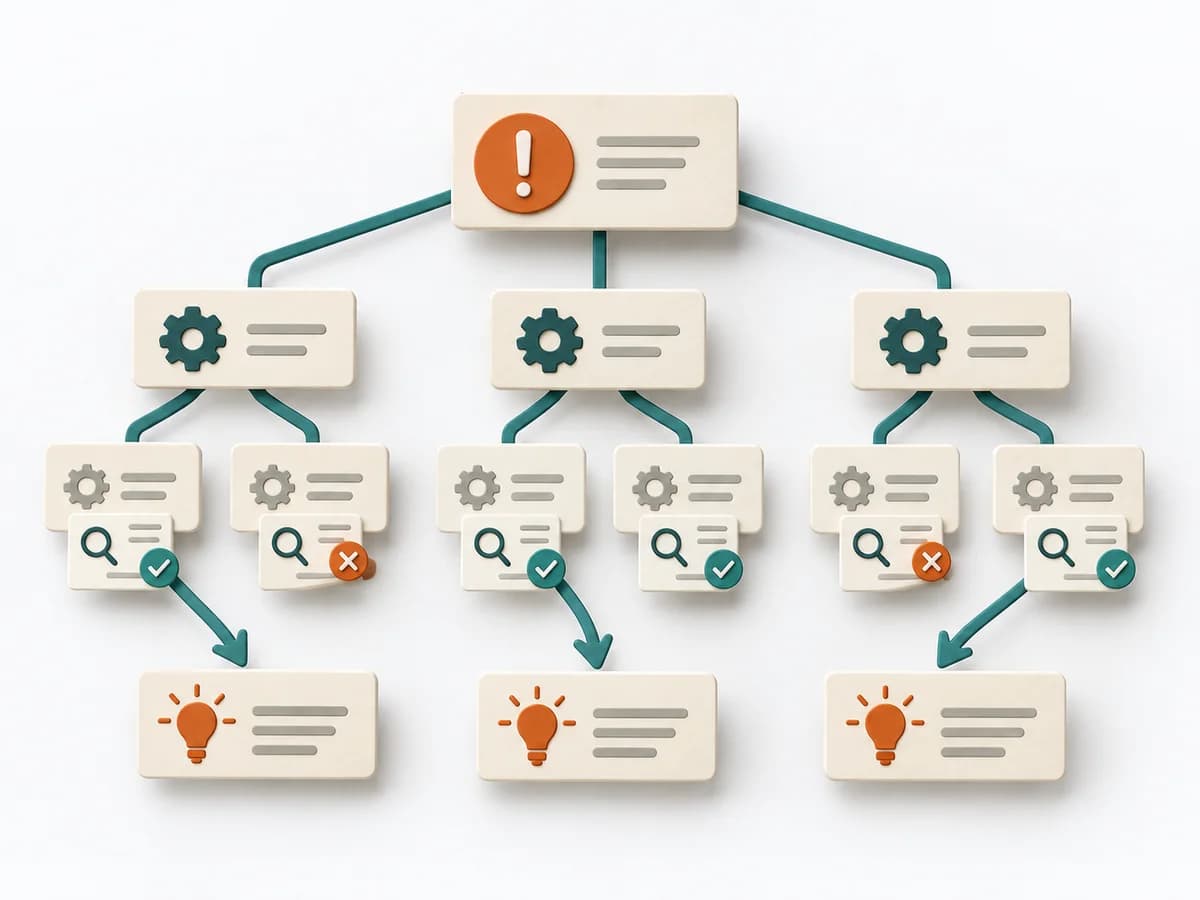
Clarifies workflows, data, causes, and improvements by framing the problem precisely, branching possible causes, and defining countermeasures.

Guides improvement work from problem definition through measurement and analysis to controls and lasting transfer.

Sorts possible causes into categories and creates a shared picture for investigation and next tests.

Clarifies workflows, data, causes, and improvements by framing the situation, analyzing the problem with is/is not, and planning risks and actions.

Coordinates team, immediate actions, root cause analysis, and prevention across eight steps to a verified solution.
