View methods side by side.
Choose up to four methods. Add them using the search and share the comparison by copying its link.
| Criterion | 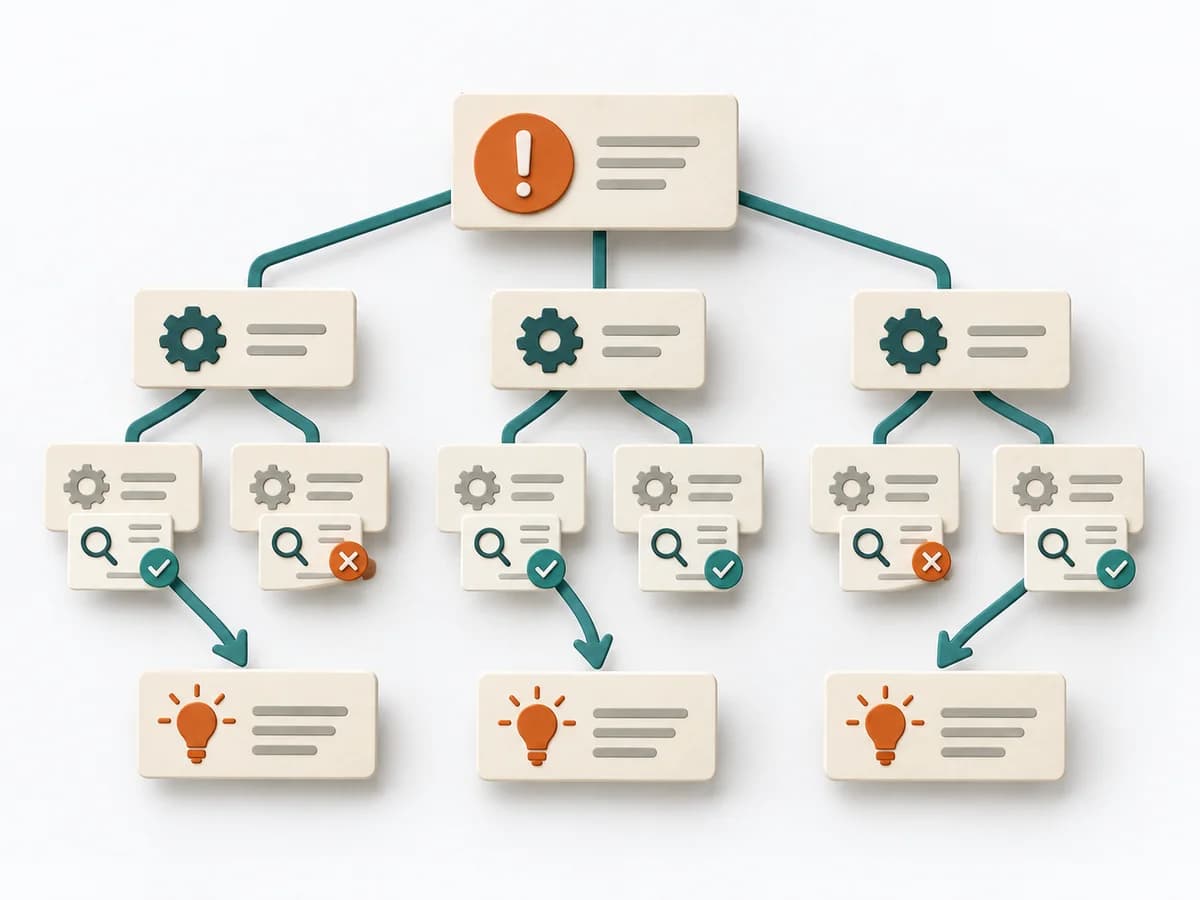 Operations Root Cause Tree Analysis | 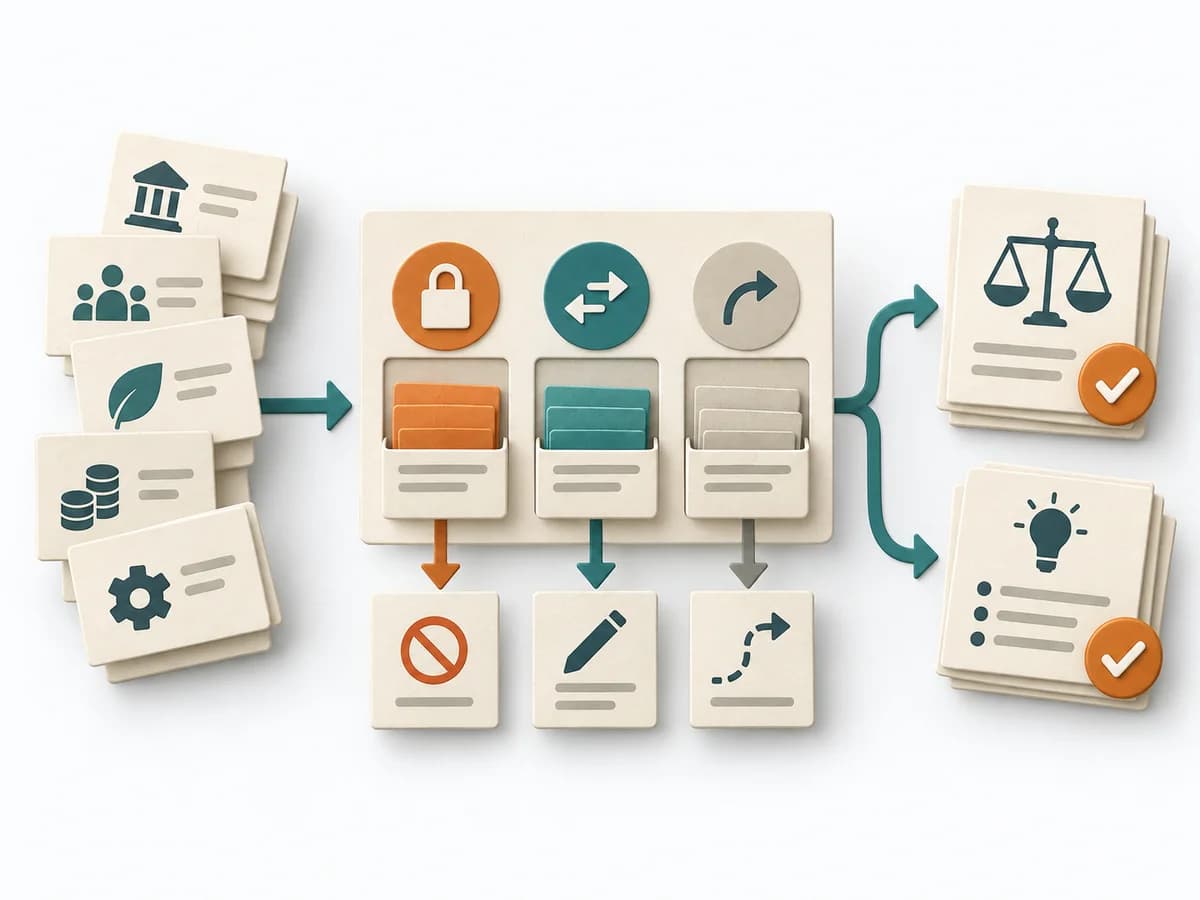 Decision Making Constraint Analysis |  Operations Failure Mode and Effects Analysis |
|---|---|---|---|
Purposedifferent | For a problem with several suspected causes, the method builds a causal structure instead of a mere list. It makes visible how causes connect and where the strongest points of leverage lie. | When an initiative stalls, the limit often lies not in the idea but in hard or soft boundary conditions. Constraint Analysis separates these limits and shows which of them can actually be shaped. | For a process, product, or service with noticeable failure risks, the method assesses possible failure modes in advance. It directs attention to combinations of occurrence, effect, and detectability. |
Complexitydifferent | Medium | Low | High |
Timedifferent | 1-3 h | 30-90 min | 2-6 h |
Participantsdifferent | 2-8 | 2-8 | 3-10 |
Formatdifferent | Workshop | Workshop + async | Workshop |
Outputdifferent | Cause Tree, Evidence Notes, Countermeasures | Constraint List, Hard/Soft Classification, Option Impact Notes, Decision Boundaries | FMEA Table, Risk Priority, Mitigation Actions |
Tagsno overlap | Root causeTreeIncidentQuality | ConstraintsDecisionPlanningOptions | RiskQualityOperationsRoot cause |
Often compared together
Methods with strong topical overlap with the current selection, not yet in the comparison.