View methods side by side.
Choose up to four methods. Add them using the search and share the comparison by copying its link.
| Criterion | 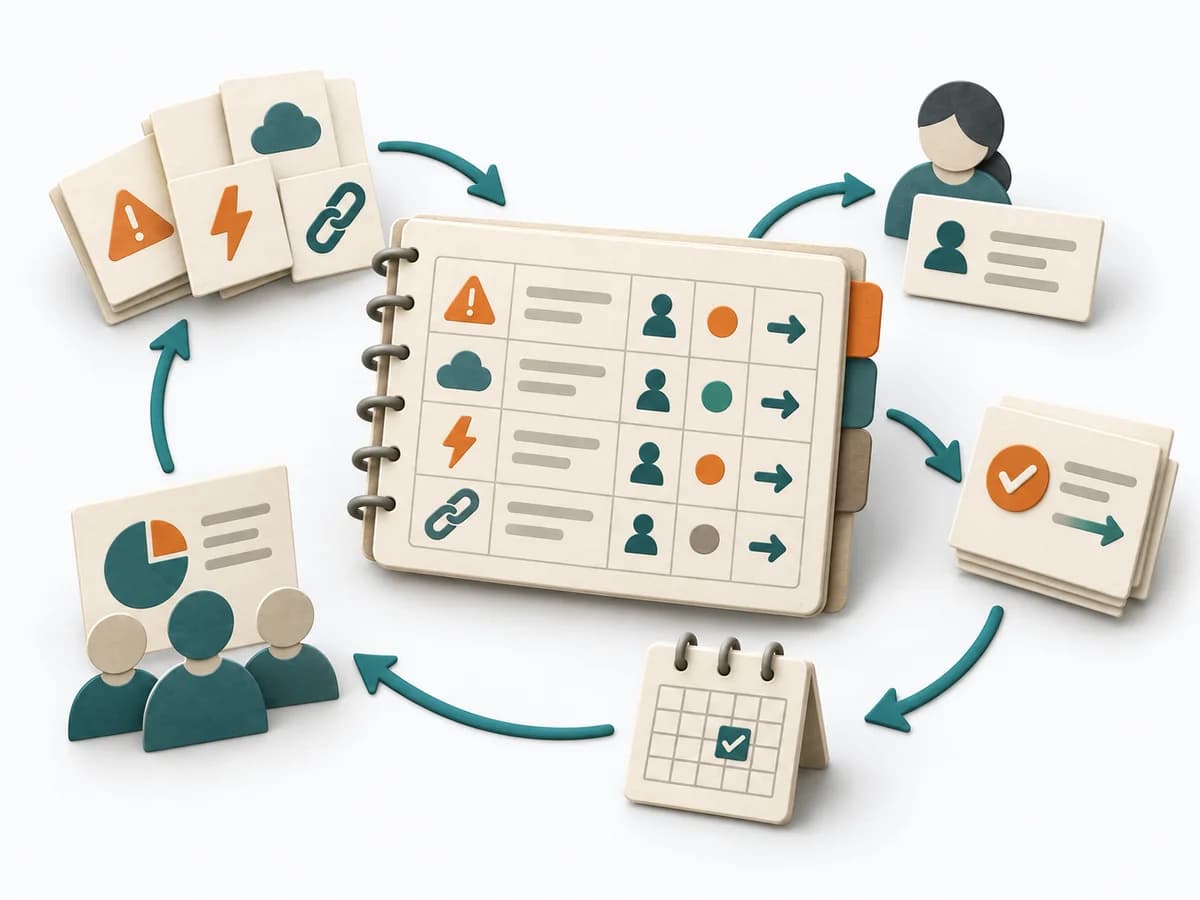 Delivery RAID Log | 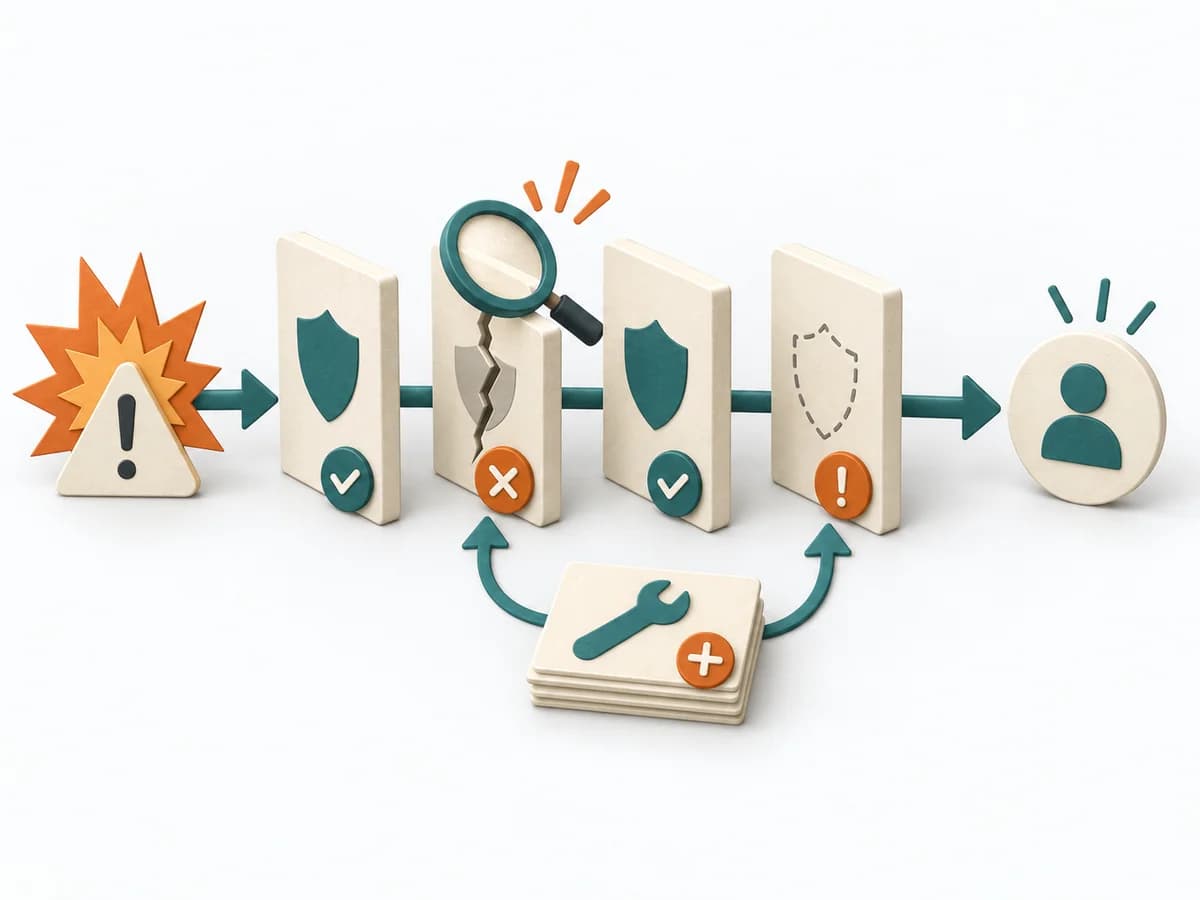 Operations Barrier Analysis |  Operations Failure Mode and Effects Analysis |
|---|---|---|---|
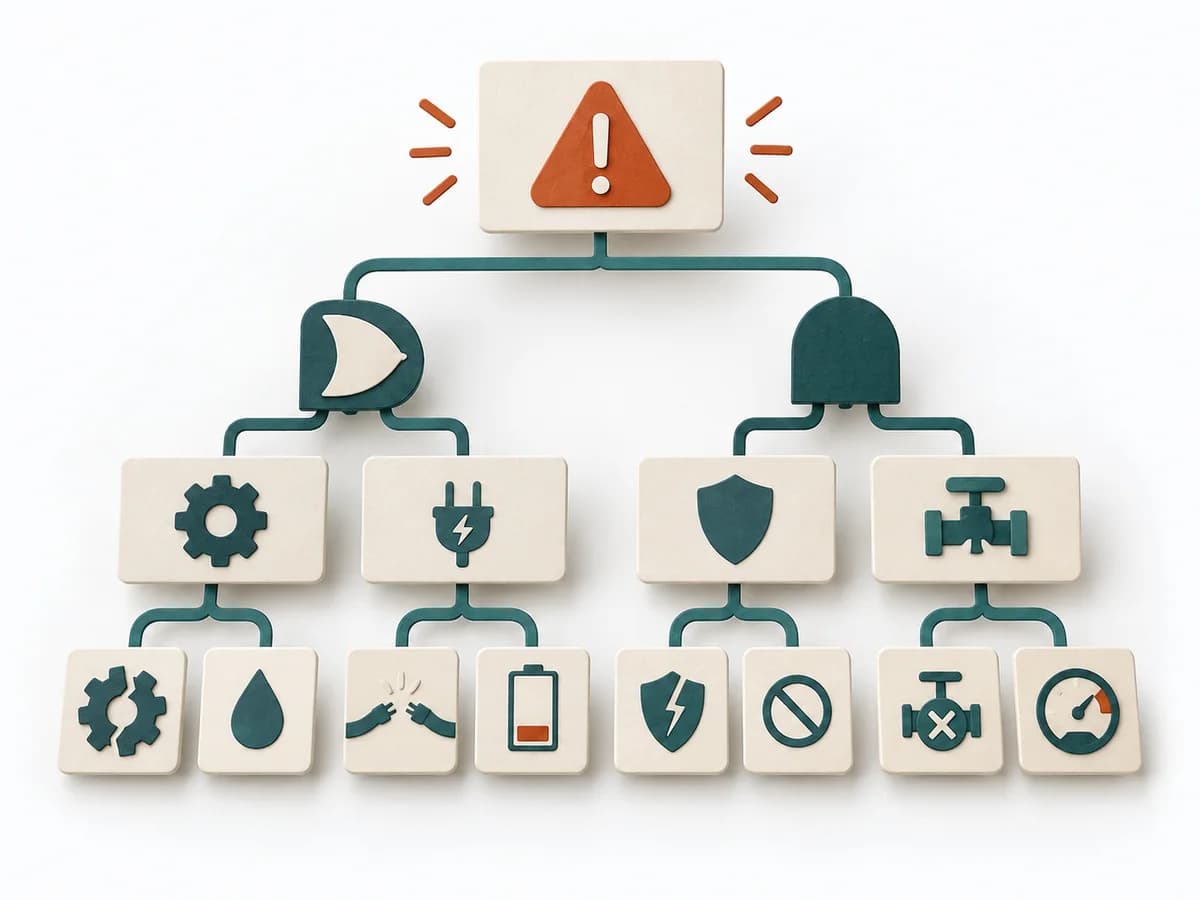
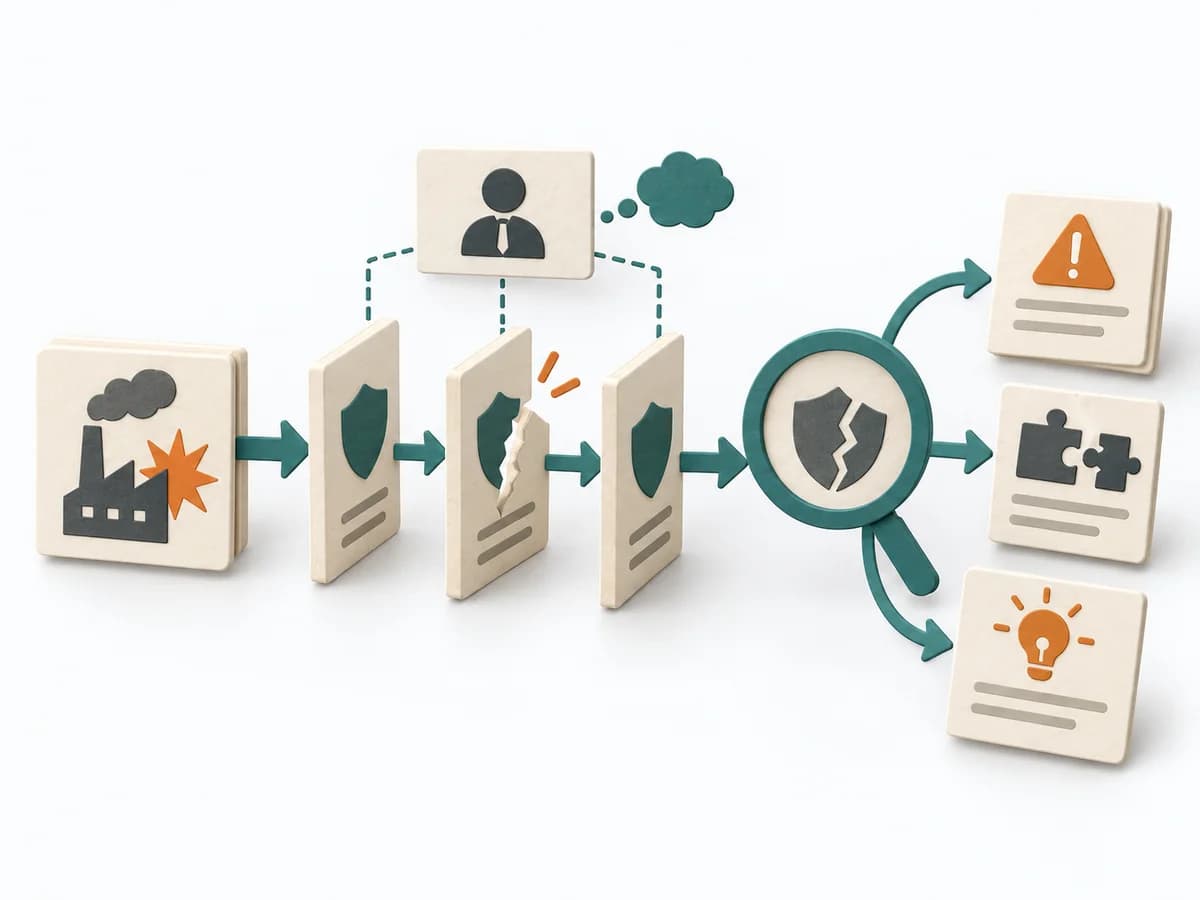
Purposedifferent | Helps clarify scope, sequence, and delivery flow in concrete terms. It makes work, boundaries, and order steerable. The result is captured as a RAID Log and a source for status reporting. | For a risk that can only be managed through multiple layers of protection, the method examines the effectiveness of each barrier. It shows where safeguards are missing, too weak, or fail under real conditions. | For a process, product, or service with noticeable failure risks, the method assesses possible failure modes in advance. It directs attention to combinations of occurrence, effect, and detectability. |
Complexitydifferent | Low | Medium | High |
Timedifferent | 30 min Setup, dann laufend | 2-4 h | 2-6 h |
Participantsdifferent | 1-3 maintaining, briefing for everyone | 2-6 | 3-10 |
Formatdifferent | Async | Workshop + async | Workshop |
Outputdifferent | RAID Log, Status Report Source | Barrier Inventory, Failure Analysis per Barrier, Action Backlog | FMEA Table, Risk Priority, Mitigation Actions |
Tagsno overlap | RiskTrackingStakeholdersGovernance | Root causeSafetyIncident | RiskQualityOperationsRoot cause |
Often compared together
Methods with strong topical overlap with the current selection, not yet in the comparison.