View methods side by side.
Choose up to four methods. Add them using the search and share the comparison by copying its link.
| Criterion |  Facilitation Power Interest Grid | 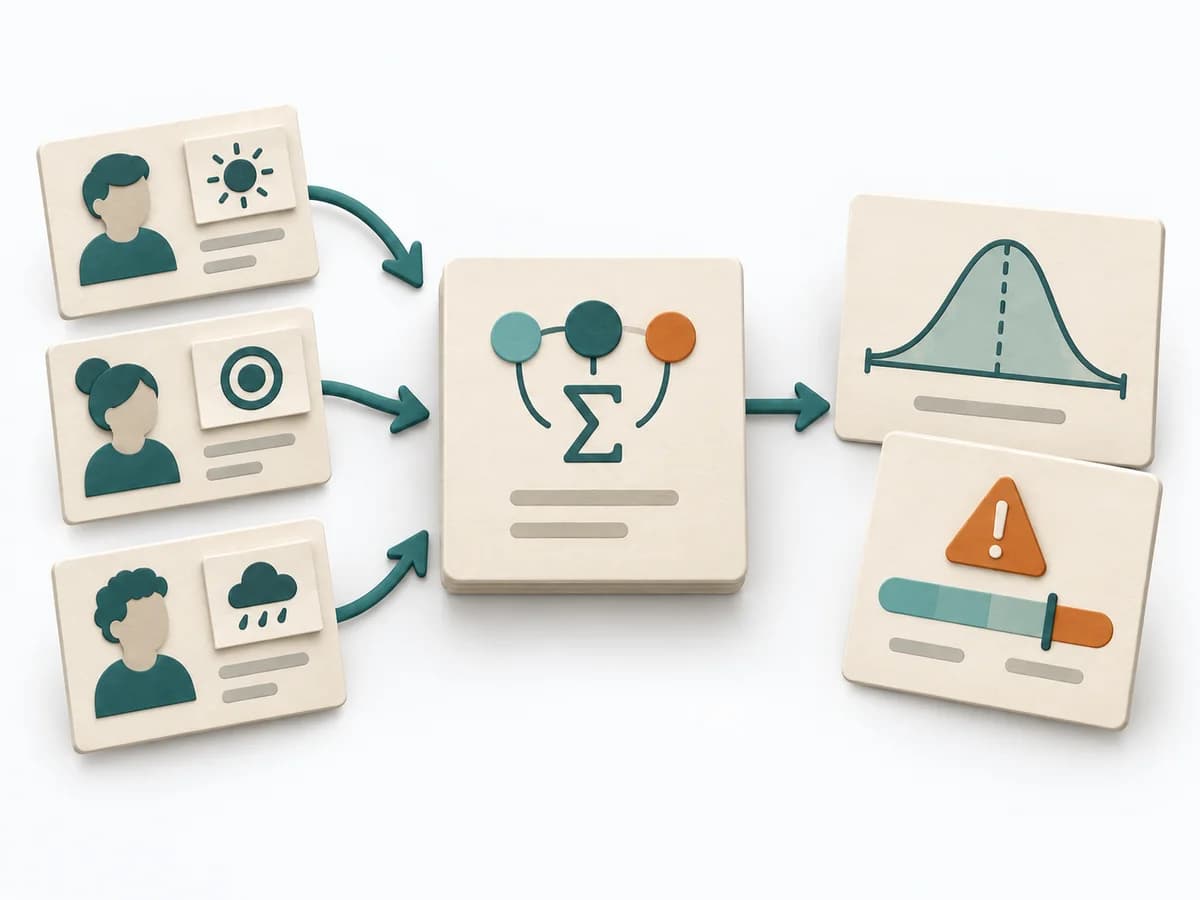 Decision Making PERT Estimation |  Facilitation 3-Circle Venn Diagram |
|---|---|---|---|
Purposedifferent | When many stakeholders compete for attention at once, the Power Interest Grid sorts them by influence and stake. It turns individual contributions into a visible selection. The result is captured as a Power Interest Grid and a stakeholder-specific strategy. | On complex initiatives, a plain average tends to understate just how uncertain the outcome really is. It separates options, evaluation criteria, and open risks. The result is captured as a PERT Estimate, Expected Value, and Risk Notes. | When three perspectives matter at the same time, a Three-Circle Venn Diagram shows the overlaps and remainders precisely. It makes visible where shared effect arises and where only a partial perspective applies. |
Complexitydifferent | Low | Medium | Low |
Timedifferent | 30-60 min | 15-45 min | 15-45 min |
Participantsdifferent | 2-8 | 1-8 | 2-8 |
Formatdifferent | Workshop | Workshop + async | Workshop + async |
Outputdifferent | Power Interest Grid, Strategy per Stakeholder | PERT Estimate, Expected Value, Risk Notes | Venn Diagram, Overlap Notes, Differentiators |
Tagsno overlap | StakeholdersFacilitationAlignmentPlanning | EstimationUncertaintyRisk | ComparisonFacilitationAlignment |
Often compared together
Methods with strong topical overlap with the current selection, not yet in the comparison.