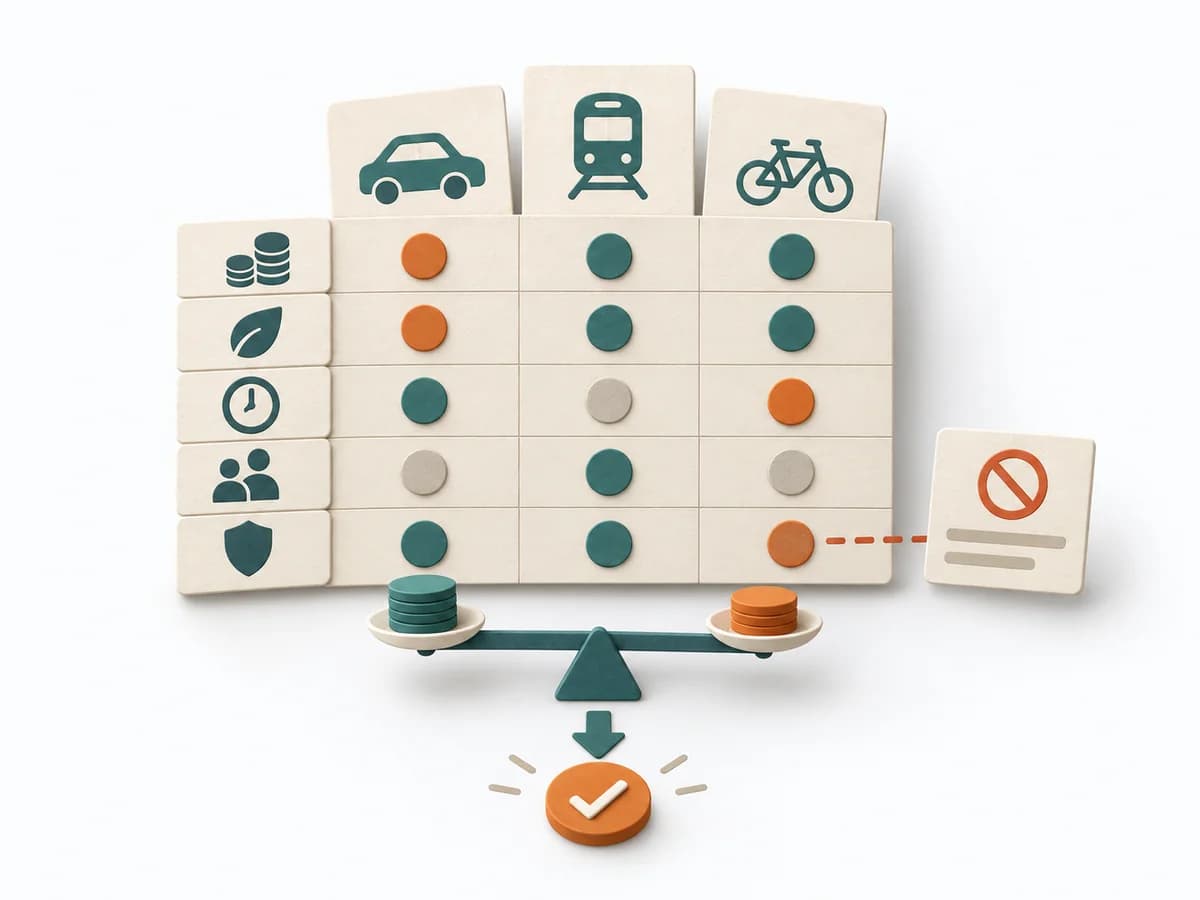
View methods side by side.
Choose up to four methods. Add them using the search and share the comparison by copying its link.
| Criterion | 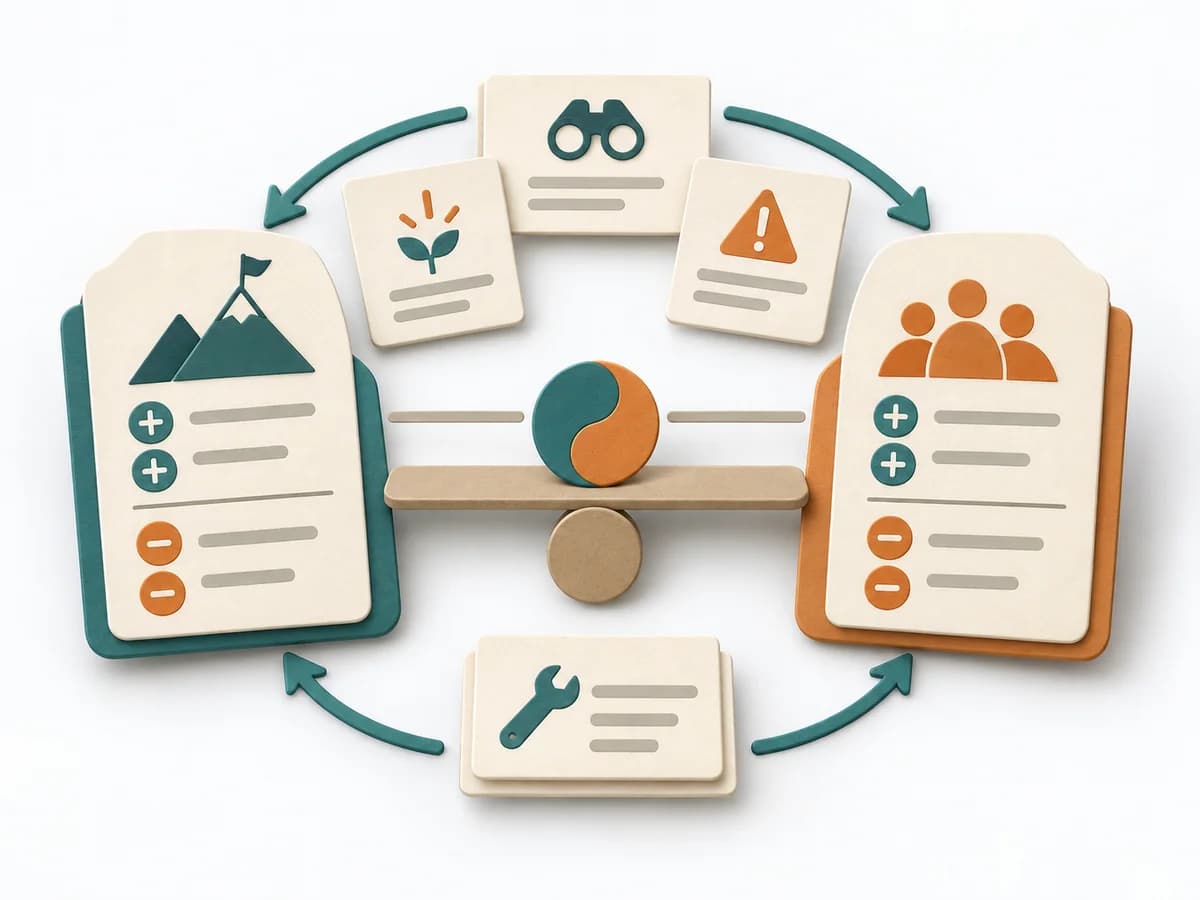 Systems Thinking Polarity Mapping |  Facilitation Six Thinking Hats |  Operations Causal Factor Analysis |
|---|---|---|---|
Purposedifferent | Polarity Mapping makes tensions between two opposing poles tangible, such as standardization and adaptation or control and autonomy. The method guards against making apparent either-or decisions prematurely. | When a topic gets stuck too quickly in the same thinking mode, Six Thinking Hats deliberately separates the perspectives. This means facts, risks, creativity, and emotional signals get worked through one after another instead of mixed together. | For an event with a complicated course, the method breaks down the contributing factors along the timeline. It shows how conditions, decisions, and reactions together produce a course of events. |
Complexitydifferent | Medium | Medium | High |
Timedifferent | 1-2 h | 45-90 min | 2-6 h |
Participantsdifferent | 3-12 | 4-12 | 3-10 |
Formatdifferent | Workshop | Workshop | Workshop + async |
Outputdifferent | Polarity Map, Warning Signs, Balance Actions | Perspective Notes, Decision Inputs, Action Items | Event Timeline, Causal Factor Chart, Cause List, Corrective Actions |
Tagsno overlap | Systems thinkingTradeoffsLeadership | FacilitationOptionsDecision | CausalityIncidentRoot causeTimeline |
Often compared together
Methods with strong topical overlap with the current selection, not yet in the comparison.