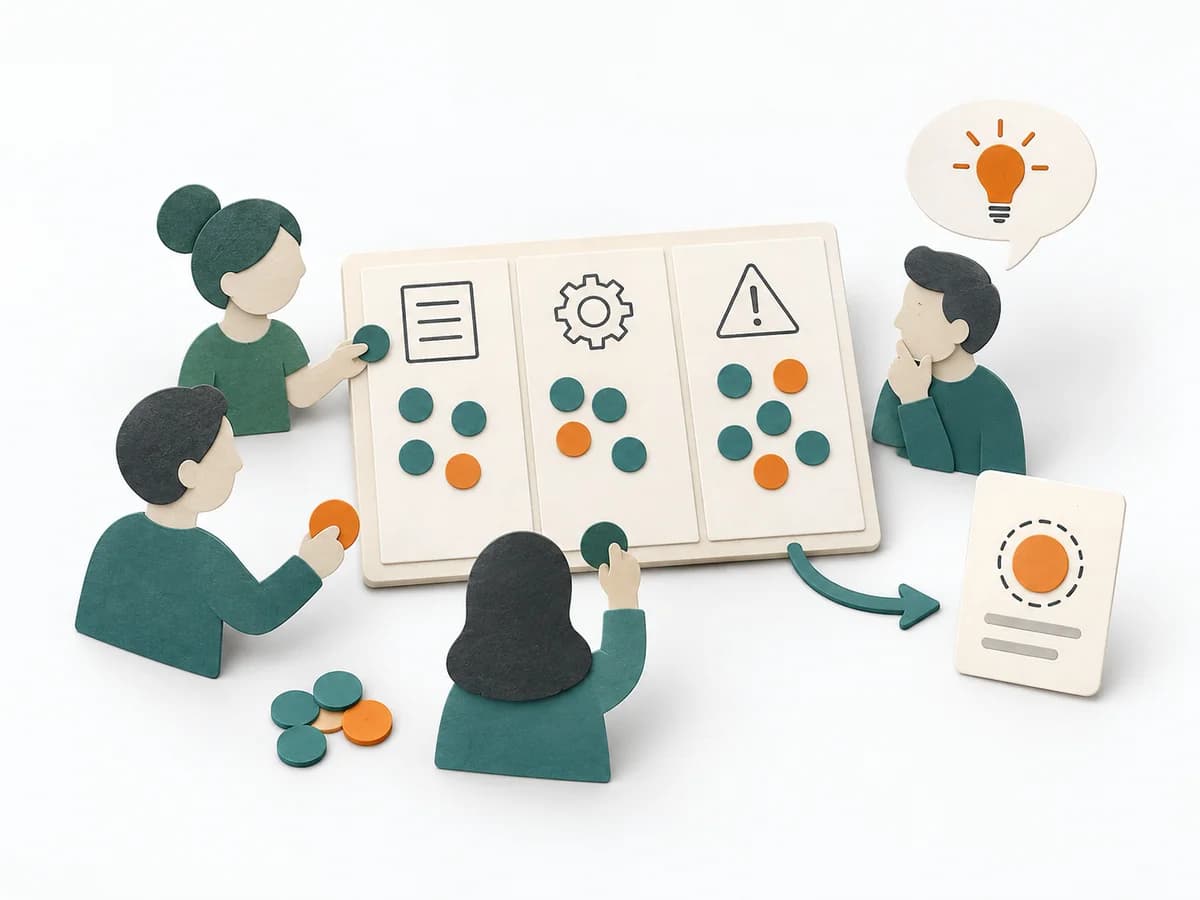
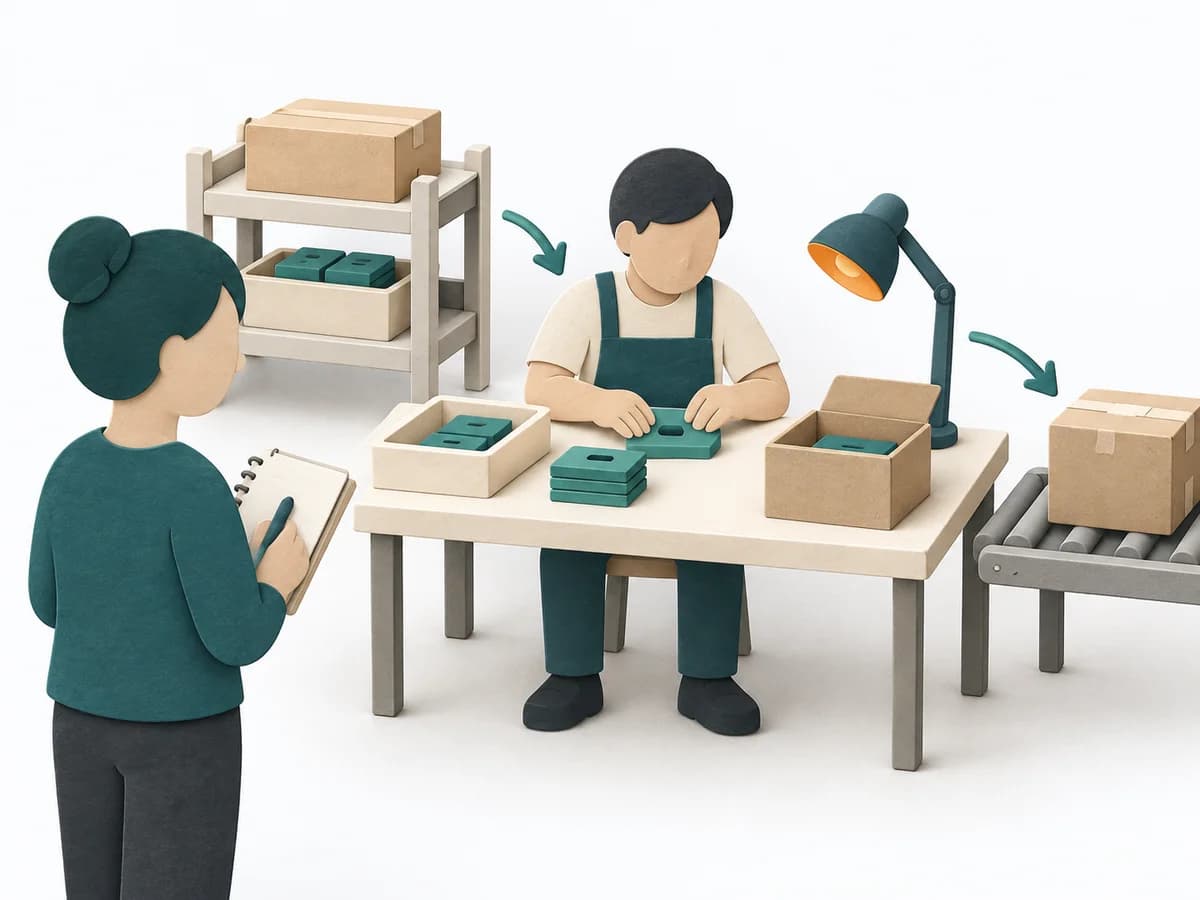
View methods side by side.
Choose up to four methods. Add them using the search and share the comparison by copying its link.
| Criterion | 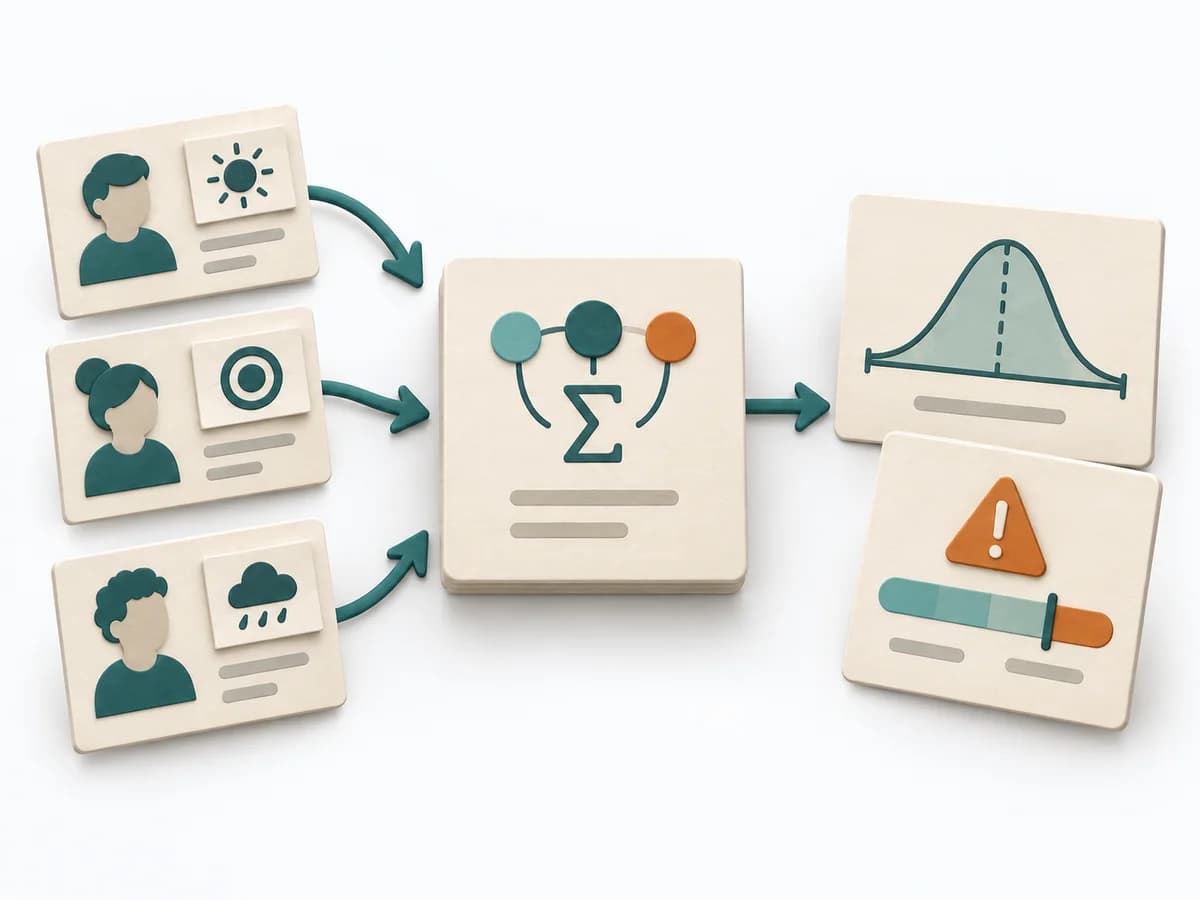 Decision Making PERT Estimation |  Operations A3 Problem Solving | 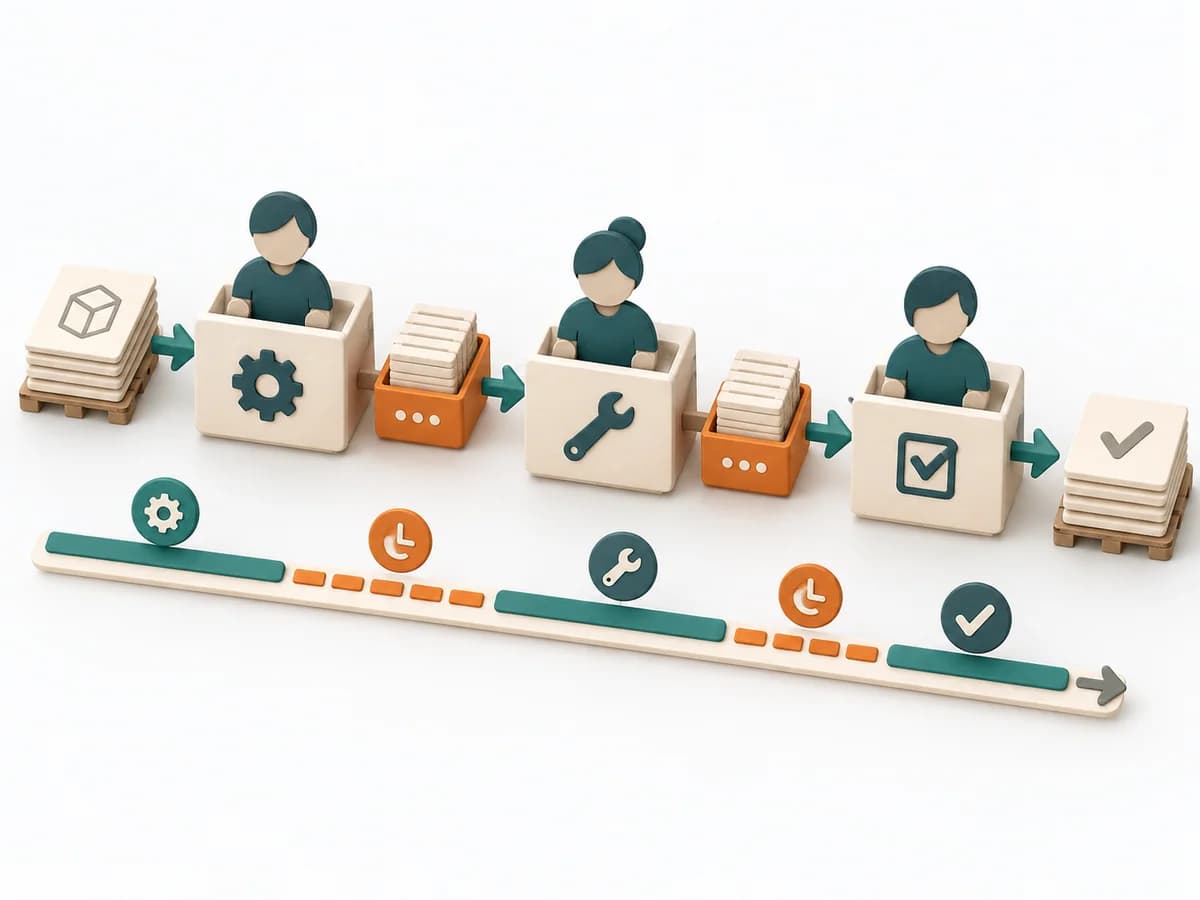 Delivery Value Stream Mapping |
|---|---|---|---|
Purposedifferent | On complex initiatives, a plain average tends to understate just how uncertain the outcome really is. It separates options, evaluation criteria, and open risks. The result is captured as a PERT Estimate, Expected Value, and Risk Notes. | For a complex deviation with several people involved, the method bundles problem, analysis, and decision onto one page. It creates a shared working space where causes, countermeasures, and follow-up fit together. | When delivery work dissolves into wait times, handoffs, and hidden effort, Value Stream Mapping makes the actual flow visible. The method exposes bottlenecks, idle time, and feedback loops so lead time and improvement levers become tangible. |
Complexitysame | Medium | Medium | Medium |
Timedifferent | 15-45 min | 45-90 min | 1-3 h |
Participantsdifferent | 1-8 | 2-5 | 4-10 |
Formatdifferent | Workshop + async | Workshop + async | Workshop |
Outputdifferent | PERT Estimate, Expected Value, Risk Notes | A3 Report, Action Plan, Root Cause Analysis | Current-state map, Future-state map, Bottleneck list |
Tagsno overlap | EstimationUncertaintyRisk | LeanProblem solvingCoachingOperations | LeanFlowWasteDelivery |
Often compared together
Methods with strong topical overlap with the current selection, not yet in the comparison.