View methods side by side.
Choose up to four methods. Add them using the search and share the comparison by copying its link.
| Criterion | 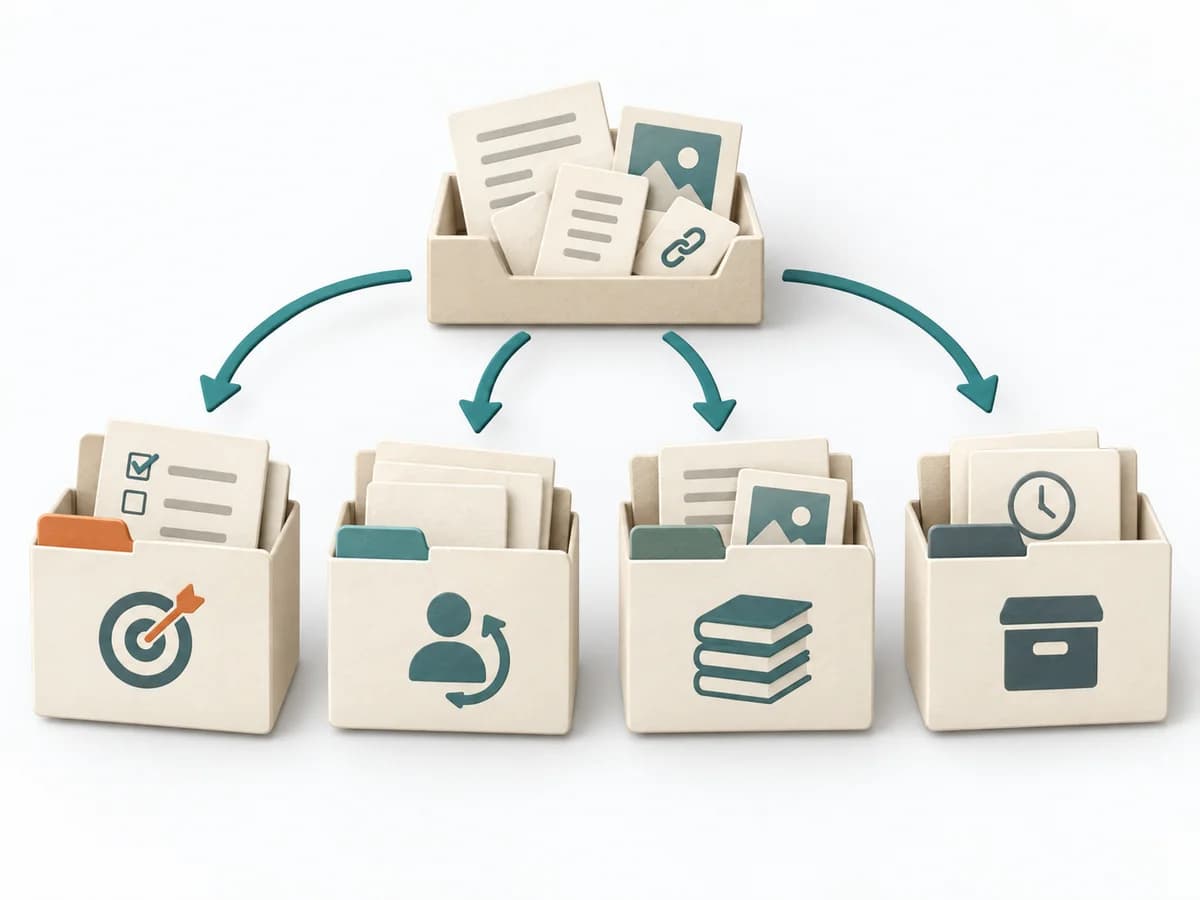 Knowledge Modeling PARA Method |  Systems Thinking Wardley Mapping |  Business Strategy McKinsey 7S |
|---|---|---|---|
Purposedifferent | The PARA Method organizes knowledge into Projects, Areas, Resources, and Archives. It creates order when digital notes, files, and tasks no longer cleanly fit current work. | Wardley Mapping makes visible where an offering stands today and where it can evolve. The method connects user need, value chain, and evolution stages into a strategic basis for platform, build, or buy decisions. | McKinsey 7S checks whether Strategy, Structure, Systems, Shared Values, Skills, Style, and Staff fit together. Organizational misalignments become visible across multiple levers as a result. |
Complexitysame | Medium | Medium | Medium |
Timedifferent | 1-3 h Setup, laufend | 1-3 h | 2-4 h |
Participantsdifferent | 1 | 2-10 | 3-12 |
Formatdifferent | Async | Workshop + async | Workshop |
Outputdifferent | PARA Structure, Project Notes, Knowledge Archive | Wardley Map, Strategic Options, Evolution Notes | 7S Assessment, Alignment Gaps, Change Actions |
Tagsno overlap | KnowledgeProductivityOrganization | StrategySystems thinkingDynamics | OrganizationStrategyAlignmentChange |
Often compared together
Methods with strong topical overlap with the current selection, not yet in the comparison.