View methods side by side.
Choose up to four methods. Add them using the search and share the comparison by copying its link.
| Criterion | 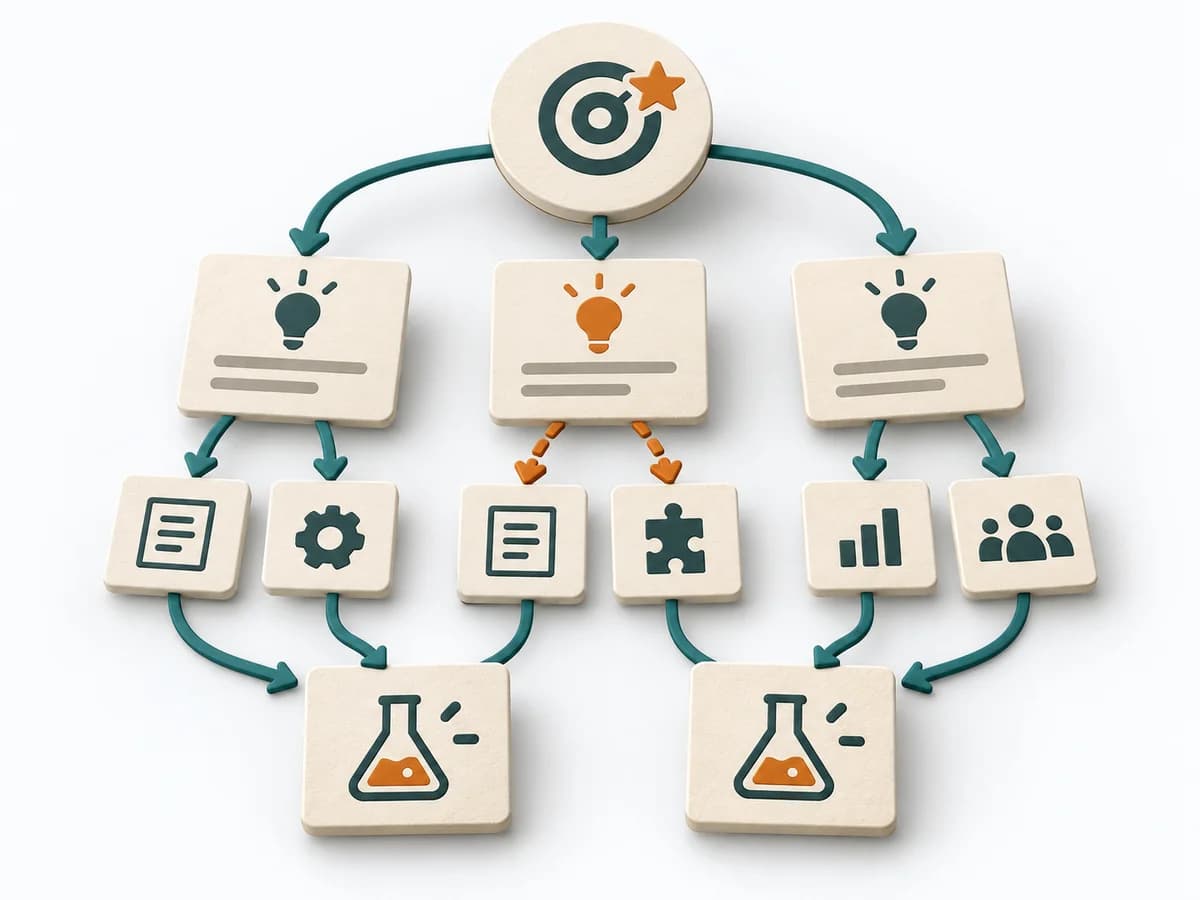 Product Discovery Opportunity Solution Tree |  Domain Modeling EventStorming |  UX Research Affinity Diagramming |
|---|---|---|---|
Purposedifferent | When discovery keeps swinging between goals, ideas, and learning loops, it creates clear steering logic. It connects the desired outcome, opportunities, and experiments into a legible structure. | When a domain consists of many events, rules, and states, it creates a shared modeling space for the team. It bundles language, flows, and boundaries before domain knowledge fragments into siloed views. | When research notes, feedback, or observations sit unconnected side by side, affinity diagramming sorts the raw material into solid themes. Many individual points turn into patterns that make decisions and opportunities clearer. |
Complexitydifferent | Medium | Medium | Low |
Timedifferent | 1-2 h Setup, laufend | 2-8 h | 45–90 min |
Participantsdifferent | 2-6 | 5-12 | 3-10 |
Formatdifferent | Workshop + async | Workshop | Workshop |
Outputdifferent | Opportunity Solution Tree, Experiment Backlog, Learning Log | Event Timeline, Ubiquitous Language, Boundaries, Open Questions | Theme clusters, Insight statements, Opportunity areas |
Tagsno overlap | DiscoveryOutcomesExperimentsOpportunity | Domain-Driven DesignEventsDiscoveryWorkshop | SynthesisQualitativeRoot cause |
Often compared together
Methods with strong topical overlap with the current selection, not yet in the comparison.