View methods side by side.
Choose up to four methods. Add them using the search and share the comparison by copying its link.
| Criterion | 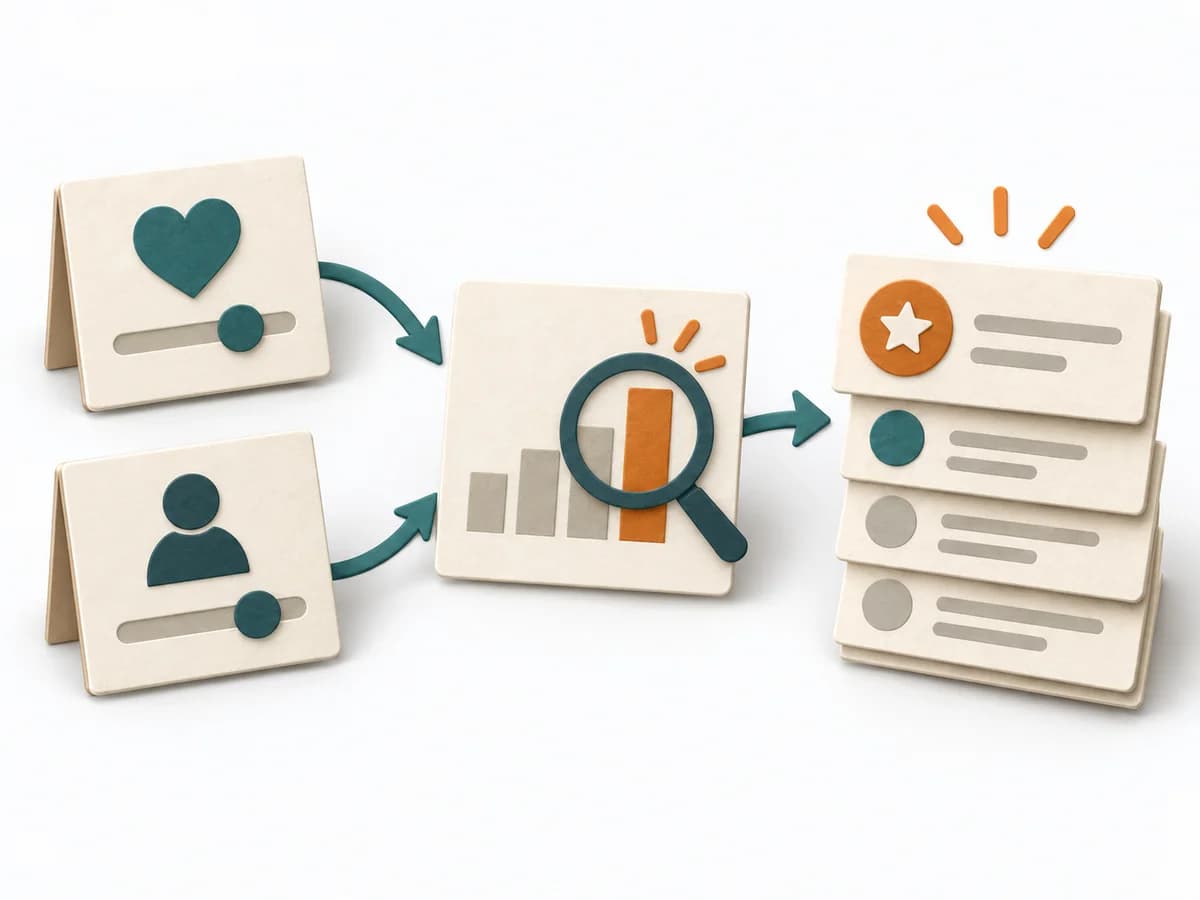 Product Discovery Opportunity Scoring |  UX Research Personas |  UX Research Empathy Mapping |
|---|---|---|---|
Purposedifferent | When opportunities need ranking by their effect, it makes importance and satisfaction directly comparable. It separates problem, assumption, solution, and evidence. The result is captured as an opportunity-score table and top outcomes. | When target groups stay too vague and teams talk about the same people differently, personas create a shared, solid picture of usage. Condensed profiles make needs, contexts, and differences tangible enough for decisions. | When a lot is assumed about a target group but little is seen jointly, empathy mapping makes knowledge and gaps directly comparable. The picture also shows which assumptions hold up and where evidence is missing. |
Complexitydifferent | Medium | Medium | Low |
Timedifferent | 60-120 min | 1-3 Tage | 30–60 min |
Participantsdifferent | 3-6 | Internes Team | 4-8 |
Formatdifferent | Workshop + async | Workshop + async | Workshop |
Outputdifferent | Opportunity Score Table, Top Outcomes | Persona Profiles, Needs Summary, Scenario Notes | Empathy Map, Assumptions List, Research Gaps |
Tagsno overlap | PrioritizationDiscoveryOutcomesNeeds | ResearchCustomerSynthesis | SynthesisQualitativeWorkshop |
Often compared together
Methods with strong topical overlap with the current selection, not yet in the comparison.