View methods side by side.
Choose up to four methods. Add them using the search and share the comparison by copying its link.
| Criterion | 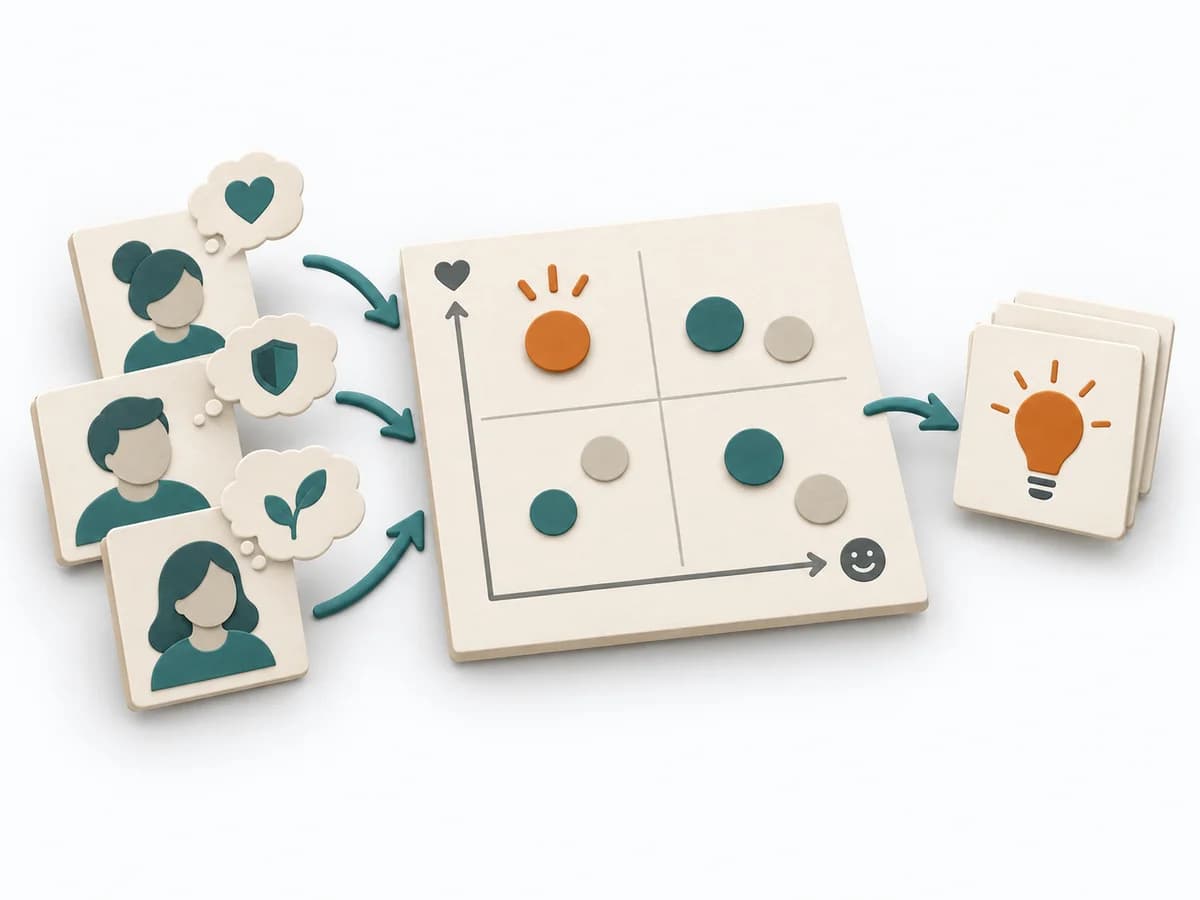 Product Discovery Outcome-Driven Innovation |  Business Strategy GAP Analysis |  UX Research Surveys |
|---|---|---|---|
Purposedifferent | Outcome-Driven Innovation clarifies customer problems, solution opportunities, and evidence. It separates jobs, desired outcomes, importance, satisfaction, and opportunity, and captures results as desired outcome statements, an opportunity landscape, and segments by underserved needs. | GAP Analysis compares the current state with a target picture and makes the distance manageable. It becomes useful when, ahead of new initiatives, it must become clear which capabilities, processes, or resources are missing. | When a topic needs to be validated broadly and many people can answer the same question, surveys gather structured feedback in a scalable form. Answers become comparable and segmentable instead of remaining merely anecdotal. |
Complexitydifferent | High | Medium | Medium |
Timedifferent | Mehrere Wochen | 1-3 h | 3-14 Tage |
Participantsdifferent | 2-6 researchers plus sample | 2-8 | 50+ |
Formatdifferent | Workshop + async | Workshop + async | Async |
Outputdifferent | Desired outcome statements, Opportunity landscape, Segmentation by underserved needs, Innovation hypotheses | Gap Matrix, Action Plan, Risk Notes | Survey Results, Charts, Segment Insights |
Tagsno overlap | OutcomesInnovationResearchQuantitative | StrategyAnalysisPlanning | QuantitativeResearchValidation |
Often compared together
Methods with strong topical overlap with the current selection, not yet in the comparison.