View methods side by side.
Choose up to four methods. Add them using the search and share the comparison by copying its link.
| Criterion | 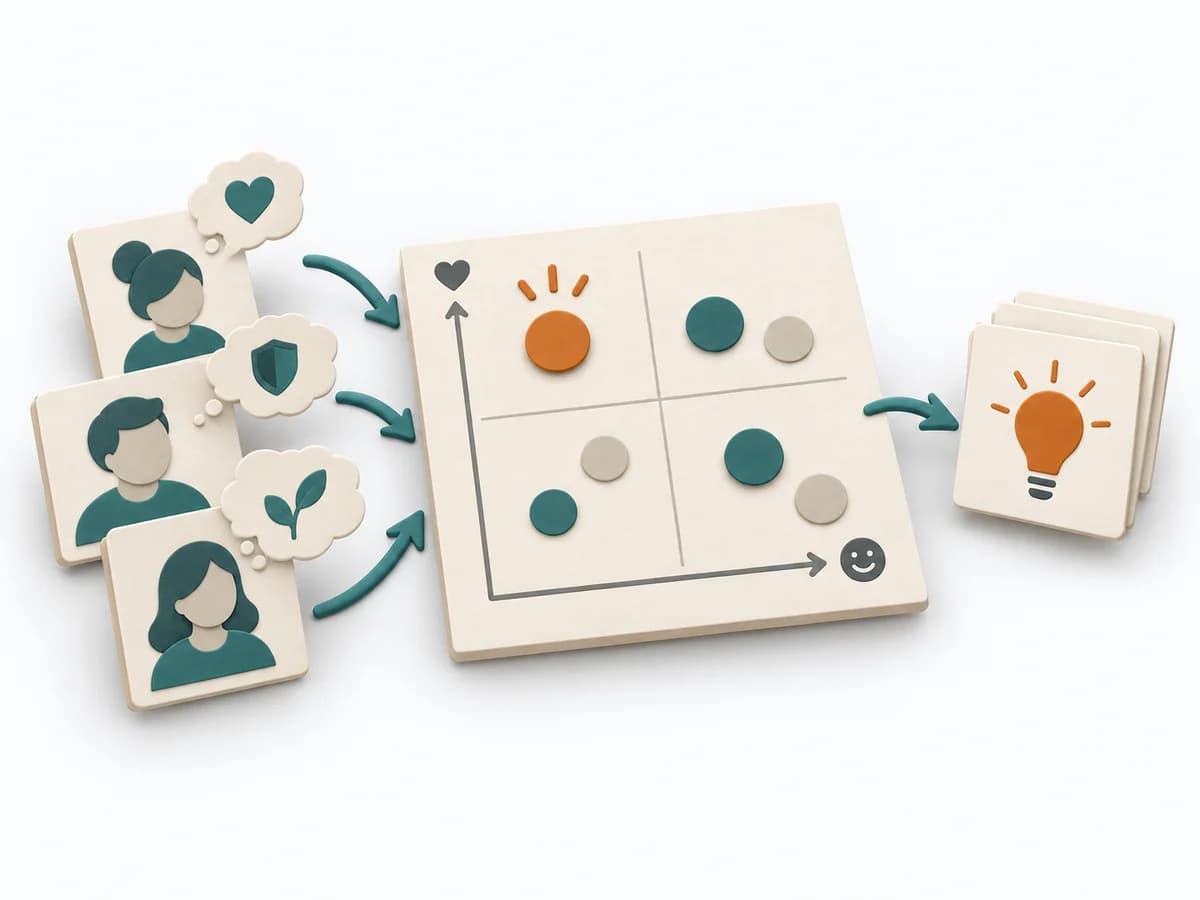 Product Discovery Outcome-Driven Innovation | 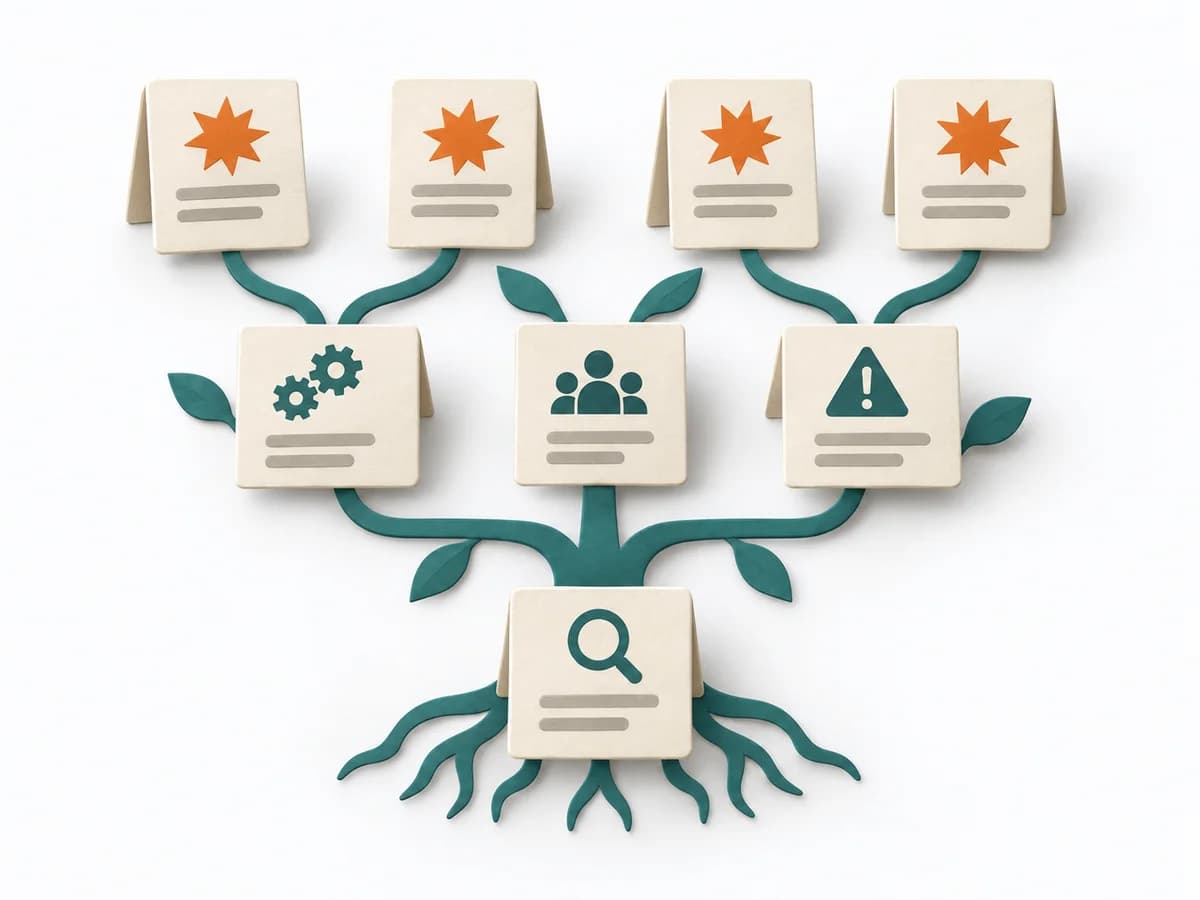 Operations Family Tree Analysis |  Systems Thinking Iceberg Model |
|---|---|---|---|
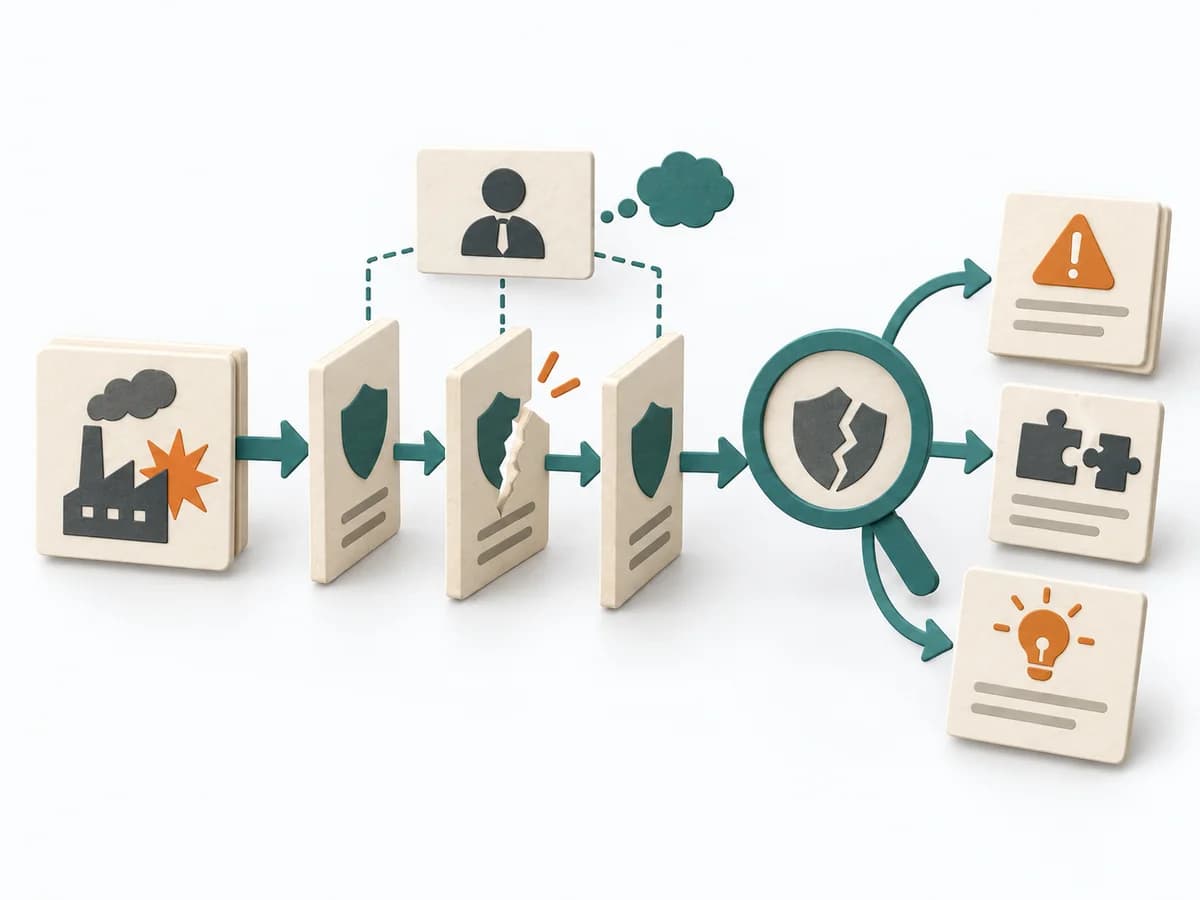
Purposedifferent | Outcome-Driven Innovation clarifies customer problems, solution opportunities, and evidence. It separates jobs, desired outcomes, importance, satisfaction, and opportunity, and captures results as desired outcome statements, an opportunity landscape, and segments by underserved needs. | For a series of incidents with a similar pattern, the method arranges individual events as branches of a common origin. It makes visible which conditions keep recurring. | The Iceberg Model separates visible events from patterns, structures, and mental models. This turns a single observation into a deeper understanding of why a problem keeps recurring. |
Complexitydifferent | High | Medium | Low |
Timedifferent | Mehrere Wochen | 2-4 h | 30-60 min |
Participantsdifferent | 2-6 researchers plus sample | 2-6 | 2-10 |
Formatsame | Workshop + async | Workshop + async | Workshop + async |
Outputdifferent | Desired outcome statements, Opportunity landscape, Segmentation by underserved needs, Innovation hypotheses | Family Tree Diagram, Pattern Notes, Systemic Measures | Iceberg Worksheet, Pattern Notes, Intervention Ideas |
Tagsno overlap | OutcomesInnovationResearchQuantitative | Root causePatternsIncidentSystemic | Systems thinkingRoot causePatterns |
Often compared together
Methods with strong topical overlap with the current selection, not yet in the comparison.