View methods side by side.
Choose up to four methods. Add them using the search and share the comparison by copying its link.
| Criterion |  Delivery Monte Carlo Forecasting | 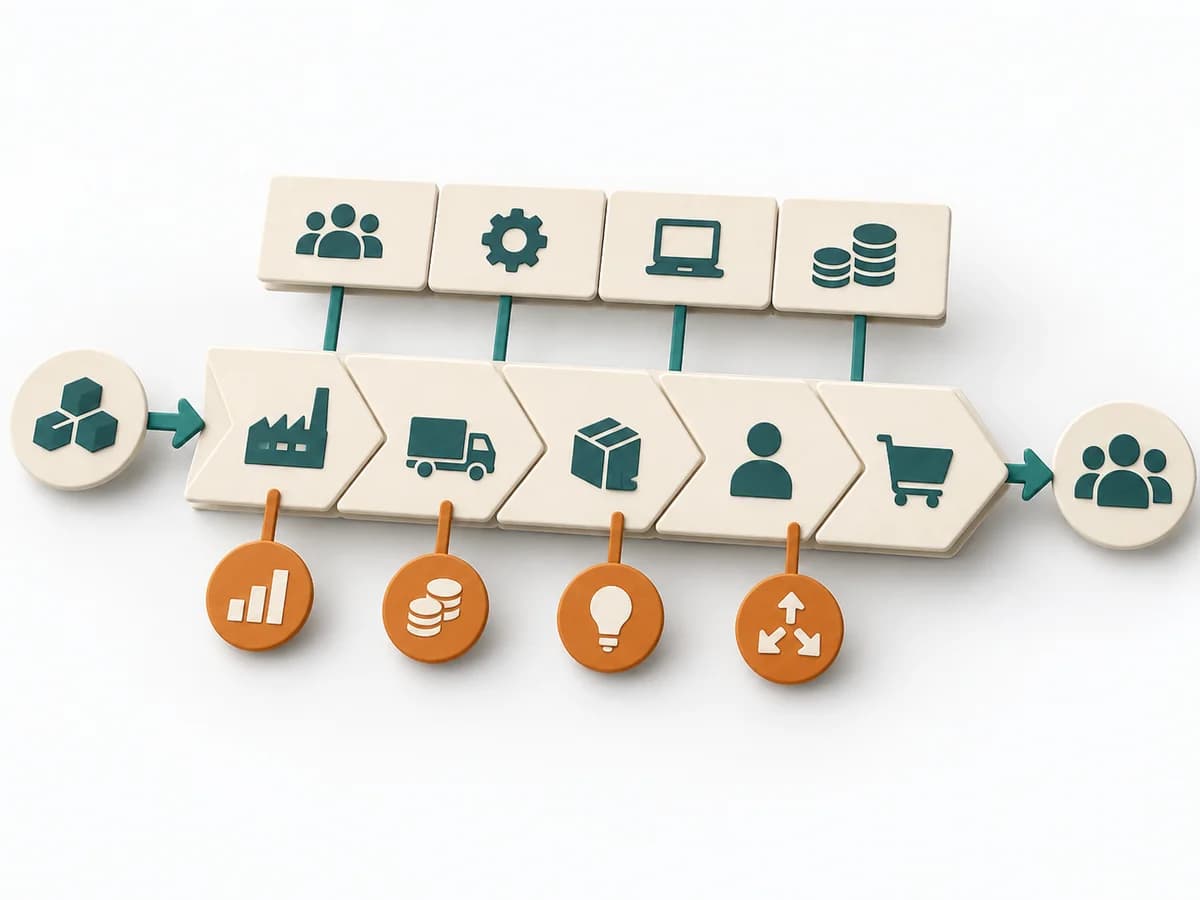 Business Strategy Value Chain Analysis | 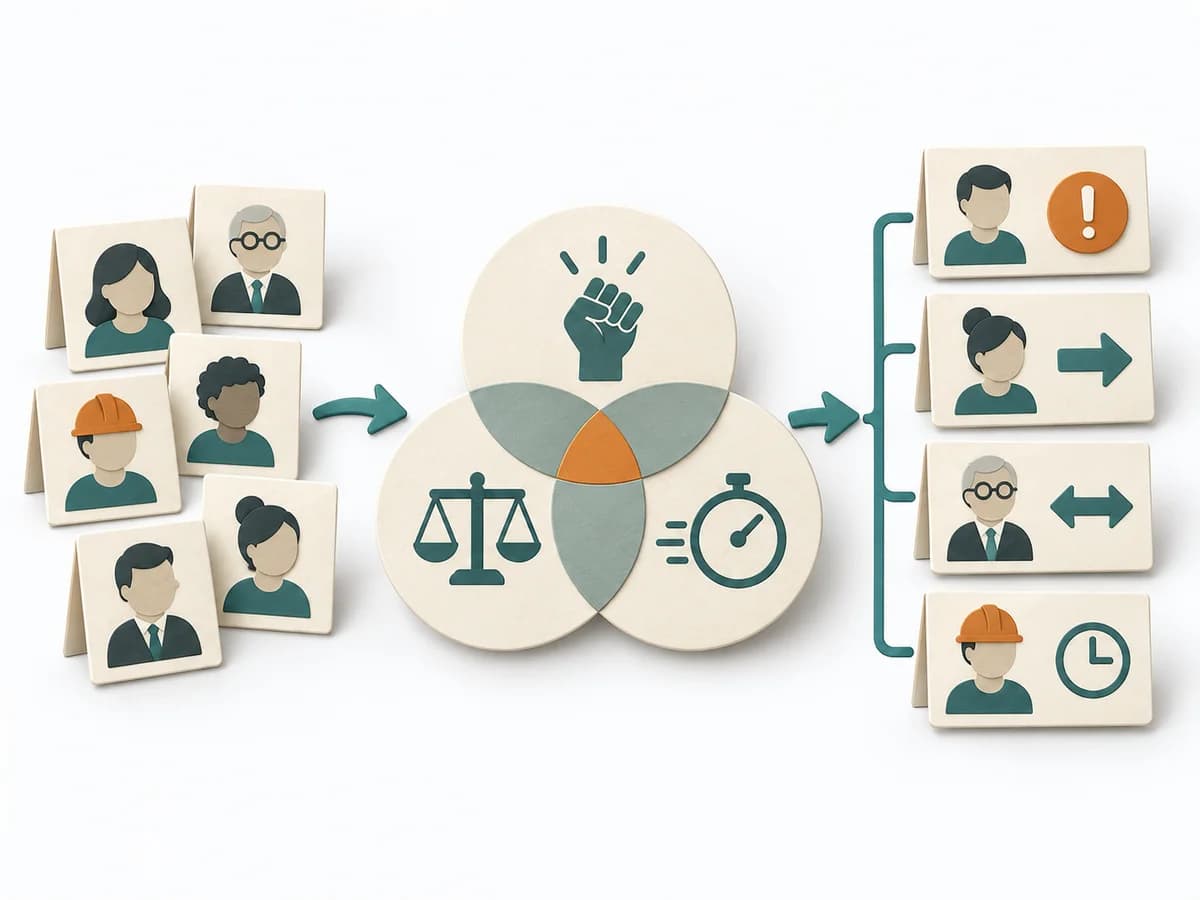 Facilitation Stakeholder Salience Model |
|---|---|---|---|
Purposedifferent | Helps clarify scope, sequence, and delivery flow in concrete terms. It makes work, boundaries, and order steerable. The result is captured as Forecast Percentiles, Throughput Dataset, and Risk Communication. | Value Chain Analysis shows where value is created, costs accrue, and differentiation becomes possible along the process. It compares strengths, risks, market logic, and courses of action. The result is captured as a value-chain map and lever list. | When stakeholders appear to matter very differently, the Stakeholder Salience Model rates their actual priority through power, legitimacy, and urgency. It turns individual contributions into a visible selection. The result is captured as a Salience diagram and a class-based strategy. |
Complexitydifferent | High | High | Medium |
Timedifferent | 30-90 min Setup, danach laufend | Half day | 60-90 min |
Participantsdifferent | 1-8 | 3-8 | 3-6 |
Formatdifferent | Workshop + async | Workshop | Workshop |
Outputdifferent | Forecast Percentiles, Throughput Dataset, Risk Communication | Value Chain Map, Lever List | Salience Diagram, Strategy per Class |
Tagsno overlap | ForecastingFlowDelivery | StrategyBusiness modelDiagnosisAnalysis | StakeholdersFacilitationAlignmentGovernance |
Often compared together
Methods with strong topical overlap with the current selection, not yet in the comparison.