View methods side by side.
Choose up to four methods. Add them using the search and share the comparison by copying its link.
| Criterion |  Facilitation Mind Mapping | 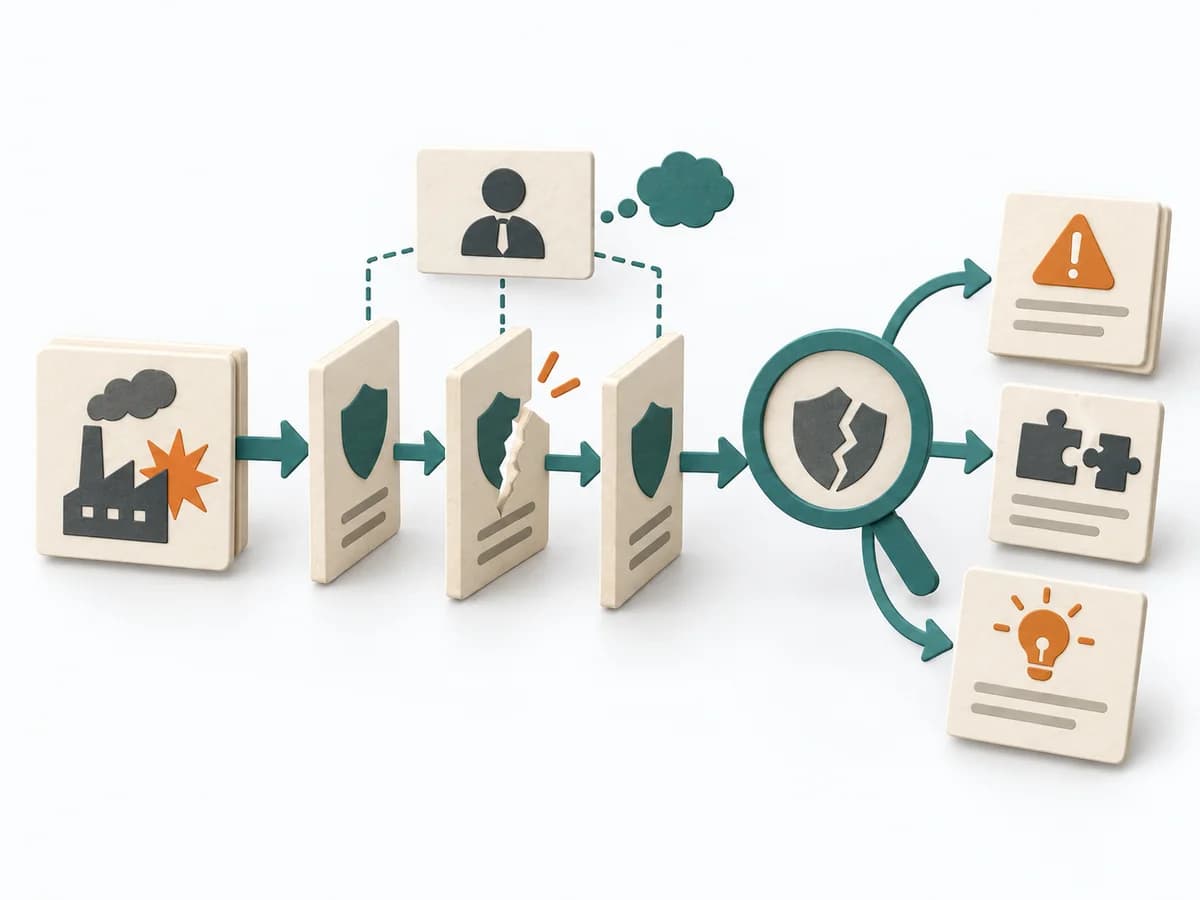 Operations MORT Analysis |  Operations Fishbone Diagram |
|---|---|---|---|
Purposedifferent | When a topic is still unclear and too many thoughts surface at once, Mind Mapping creates an open surface for ordering them. It makes connections, subtopics, and starting points visible without fixing them too early. | For a safety-relevant event or a system with high protection requirements, the method examines where controls failed. It exposes both technical and organizational gaps. | When a problem has several possible contributing factors, the method sorts causes by cause areas. It prevents an initial hunch from blocking the view of other plausible drivers. |
Complexitydifferent | Low | High | Low |
Timedifferent | 15-45 min | Mehrere Tage bis Wochen | 30-60 min |
Participantsdifferent | 1-10 | 2-6 | 2-8 |
Formatdifferent | Workshop + async | Workshop + async | Workshop |
Outputdifferent | Mind Map, Topic Clusters, Open Questions | MORT Worksheets, Findings per Branch, Corrective Actions, Systemic Recommendations | Fishbone Diagram, Cause Categories, Investigation Backlog |
Tagsno overlap | BrainstormingIdeasMappingStructureFacilitation | Root causeSafetySystemicIncident | Root causeQualityOperations |
Often compared together
Methods with strong topical overlap with the current selection, not yet in the comparison.